
Andi Bellstedt
Friday, February 27, 2026 | 19 minutes
Capture Network Traffic in Windows
What is this about?
It happens so often to me… something is weird or not working as expected, and there is the question: “What is going on? Why does the client or server behave like this?” Often, these are problems related to the network.
A security researcher told me once: “If you want to understand how a system works, you have to understand the network traffic. Nearly every problem can be diagnosed on the network level.” In my experience: Turns out, it’s true. 🥳
Unfortunately, my experience is also that many people don’t know how to capture network traffic in Windows, and the only solution is “let’s install Wireshark”.
Well, even if Wireshark is a great tool, it’s not the only solution and probably not the best solution for a quick and one-time capture. There are definitely better and probably faster solutions, especially when it comes to your well-padded highly secure servers.

Considerations about the situation
Again, Wireshark is a powerful tool and more or less, the defacto standard network protocol analyzer. You will use it to analyze what was captured, for sure. But the downside of Wireshark is:
- It is not able to capture without installing an additional component next to the product itself: a network driver (WinPcap or Npcap).
- It is a living and complex tool with a lot of binaries and potential for vulnerabilities.
- Every installation on a server is a potential attack vector and contributes to snowflaking your servers.
It is probably not a tool you want to have on a production server, especially if you just want to capture some traffic for a quick analysis.
By all means, put it on your workstation to analyze what has been captured. You do not even need to have admin rights to analyze with Wireshark! Wireshark runs perfectly fine as a portable installation without any system wide installation.
So, what are the alternatives?
There are several alternatives to get the job done in Windows. And the best part is, you do not need to install anything on the box. There are built-in tools within Windows to do the job. …and they are pretty powerful. Combined with some PowerShell and the PSRemoting capability this easily scales.
1. netsh trace - The old but gold
The netsh trace command is a built-in tool in Windows that allows you to capture network traffic without the need for additional software. It uses the Windows Event Tracing for Windows (ETW) framework to capture and log network events.
Essentially it is netsh trace start and netsh trace stop to start and stop the capture, but there is netsh trace show to show the current state and netsh trace convert to convert the captured data to a more readable format.
Here is a quick overview of the available commands in netsh trace:
The following commands are available:

Commands in this context:
?              - Displays a list of commands.
convert        - Converts a trace file to an HTML report.
correlate      - Normalizes or filters a trace file to a new output file.
diagnose       - Start a diagnose session.
dump           - Displays a configuration script.
export         - Exports a scenario to a WPR profile.
help           - Displays a list of commands.
merge          - Merges trace files and adds symbols metadata.
postreset      -
show           - List interfaces, providers and tracing state.
start          - Starts tracing.
stop           - Stops tracing.

To view help for a command, type the command, followed by a space, and then
 type ?.
Now, let’s focus on the start and stop commands, which are the ones you will use to capture network traffic. The naming is pretty self-explanatory, I guess. For starting a network capture, you need to specify a few more parameters. Basically, you just need to specify that you want to capture traffic. That is simply the parameter capture=yes.
Even if this is everything you need as an absolute minimum, there is one more parameter that is recommended for efficiency. If you only care about capturing the network traffic, you can disable the report generation behavior of netsh with report=disabled. This will speed up the capture process and reduce the size of the captured file, as it will not include the additional report data.
The rest of the parameters can be used to customize the capture process according to your needs. Of course, you can specify where to save the trace and what to capture, but it is not mandatory.
Because capturing network traffic is a system-wide operation and affects all processes (and all users) on the system, you need to run the netsh trace command(s) with administrative privileges.
Here is the basic command to start capturing network traffic using netsh trace:
# Capture network traffic on the "Ethernet" interface and save it to a file
netsh trace start capture=yes report=disabled
as soon as you have what you need, you can stop the capture with the following command:
# Stop the network traffic capture
netsh trace stop
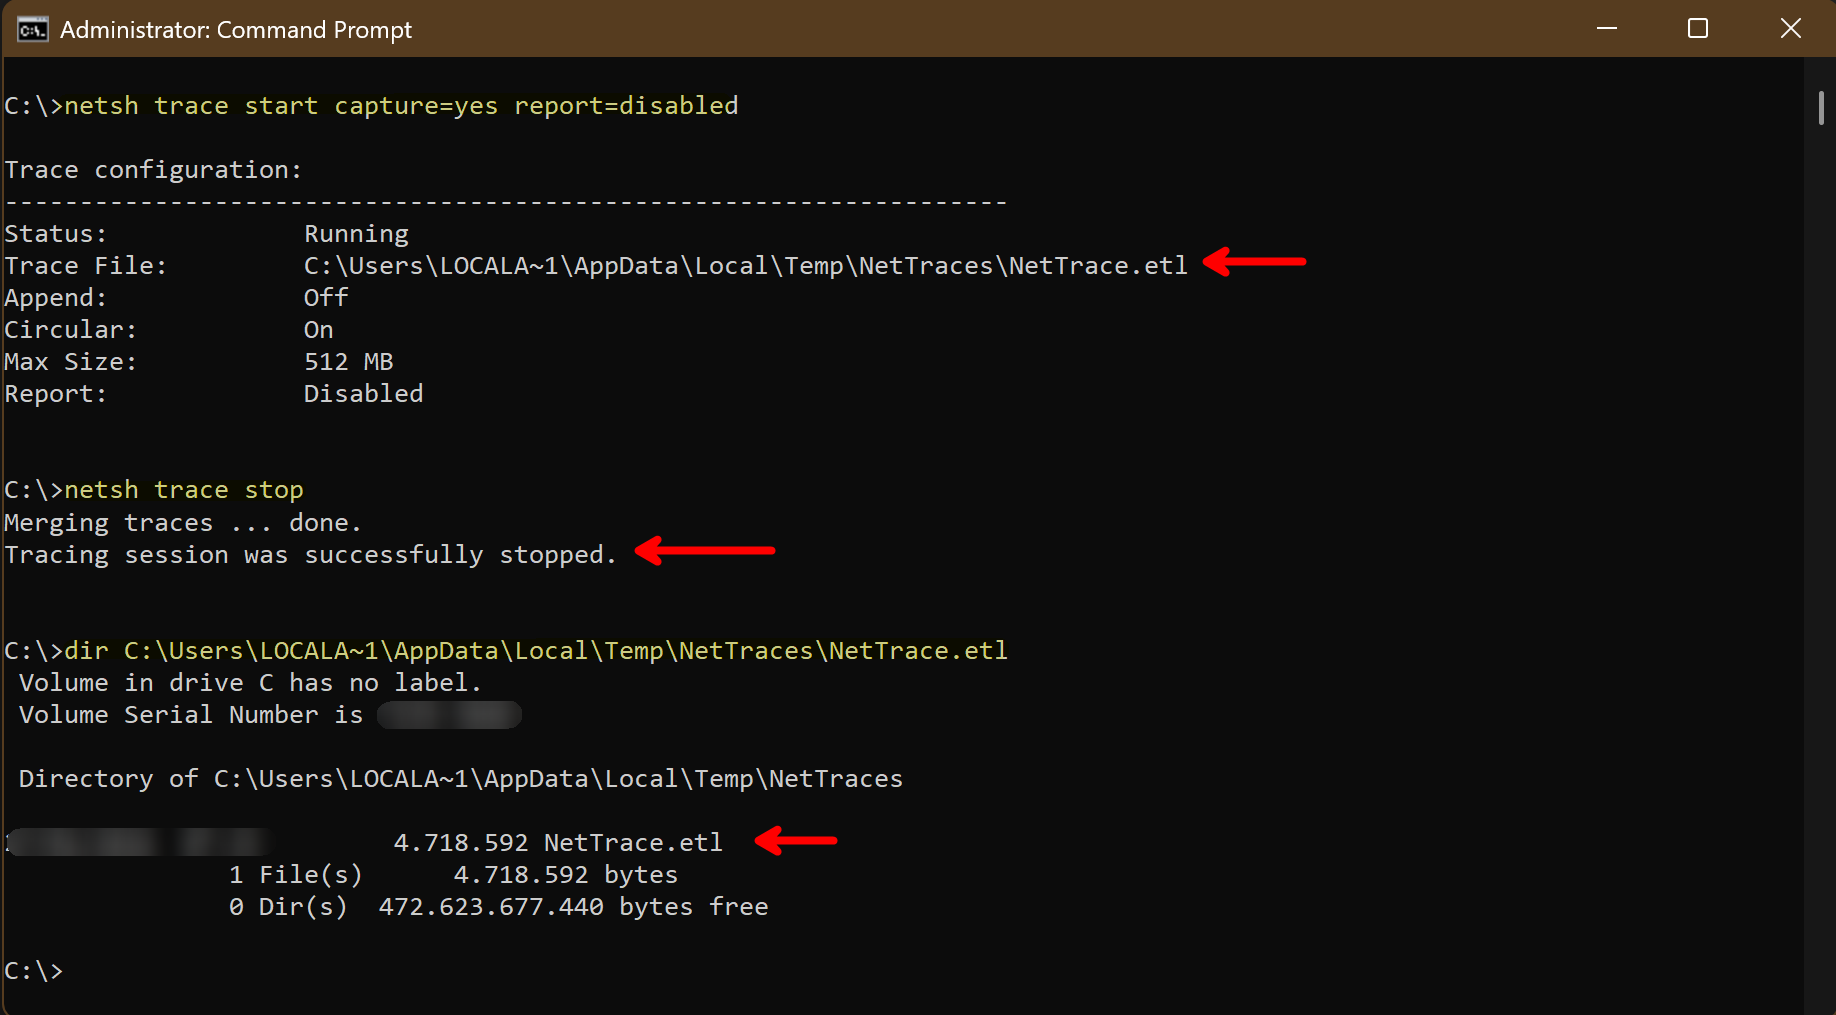
The captured traffic is saved in a .etl file, which can be analyzed later on. If you want to have a custom filename and location for the captured data, you can specify it with the tracefile parameter.
# Capture network traffic and save it to a specific file
netsh trace start capture=yes report=disabled tracefile=C:\Administration\Logs\MyTraceFile.etl
Now that we have captured the traffic, we need to analyze it...
Opening the etl-file in Wireshark requires - unfortunately - an additional step. But, stay with me, it is not that hard and it still does not require an installation:
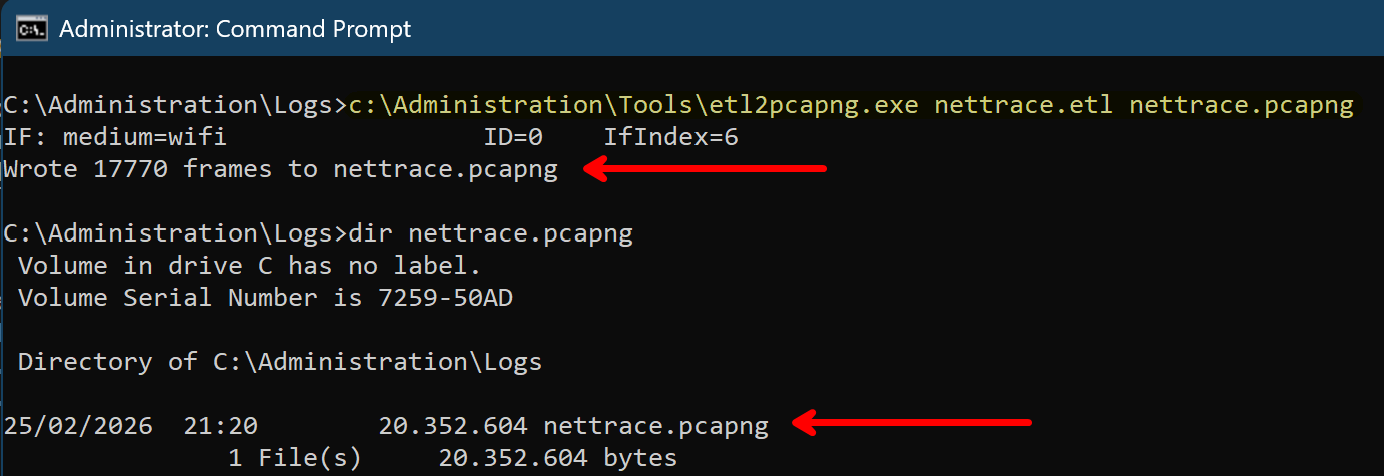
Just use etl2pcapng, a very little tool provided by Microsoft, and you’re good to go. It converts the etl-file to a pcapng-file, which can be easily opened in Wireshark for analysis.
# Convert the .etl file to .pcapng format
etl2pcapng nettrace.etl nettrace.pcapng
For sure, the filename in the command is allowed to be fully qualified path, including drive letter and directories. This is just a quick example.
The created etl-file can be removed after the conversion, if you do not need it anymore. The pcapng-file is the one you will use for analysis in Wireshark.
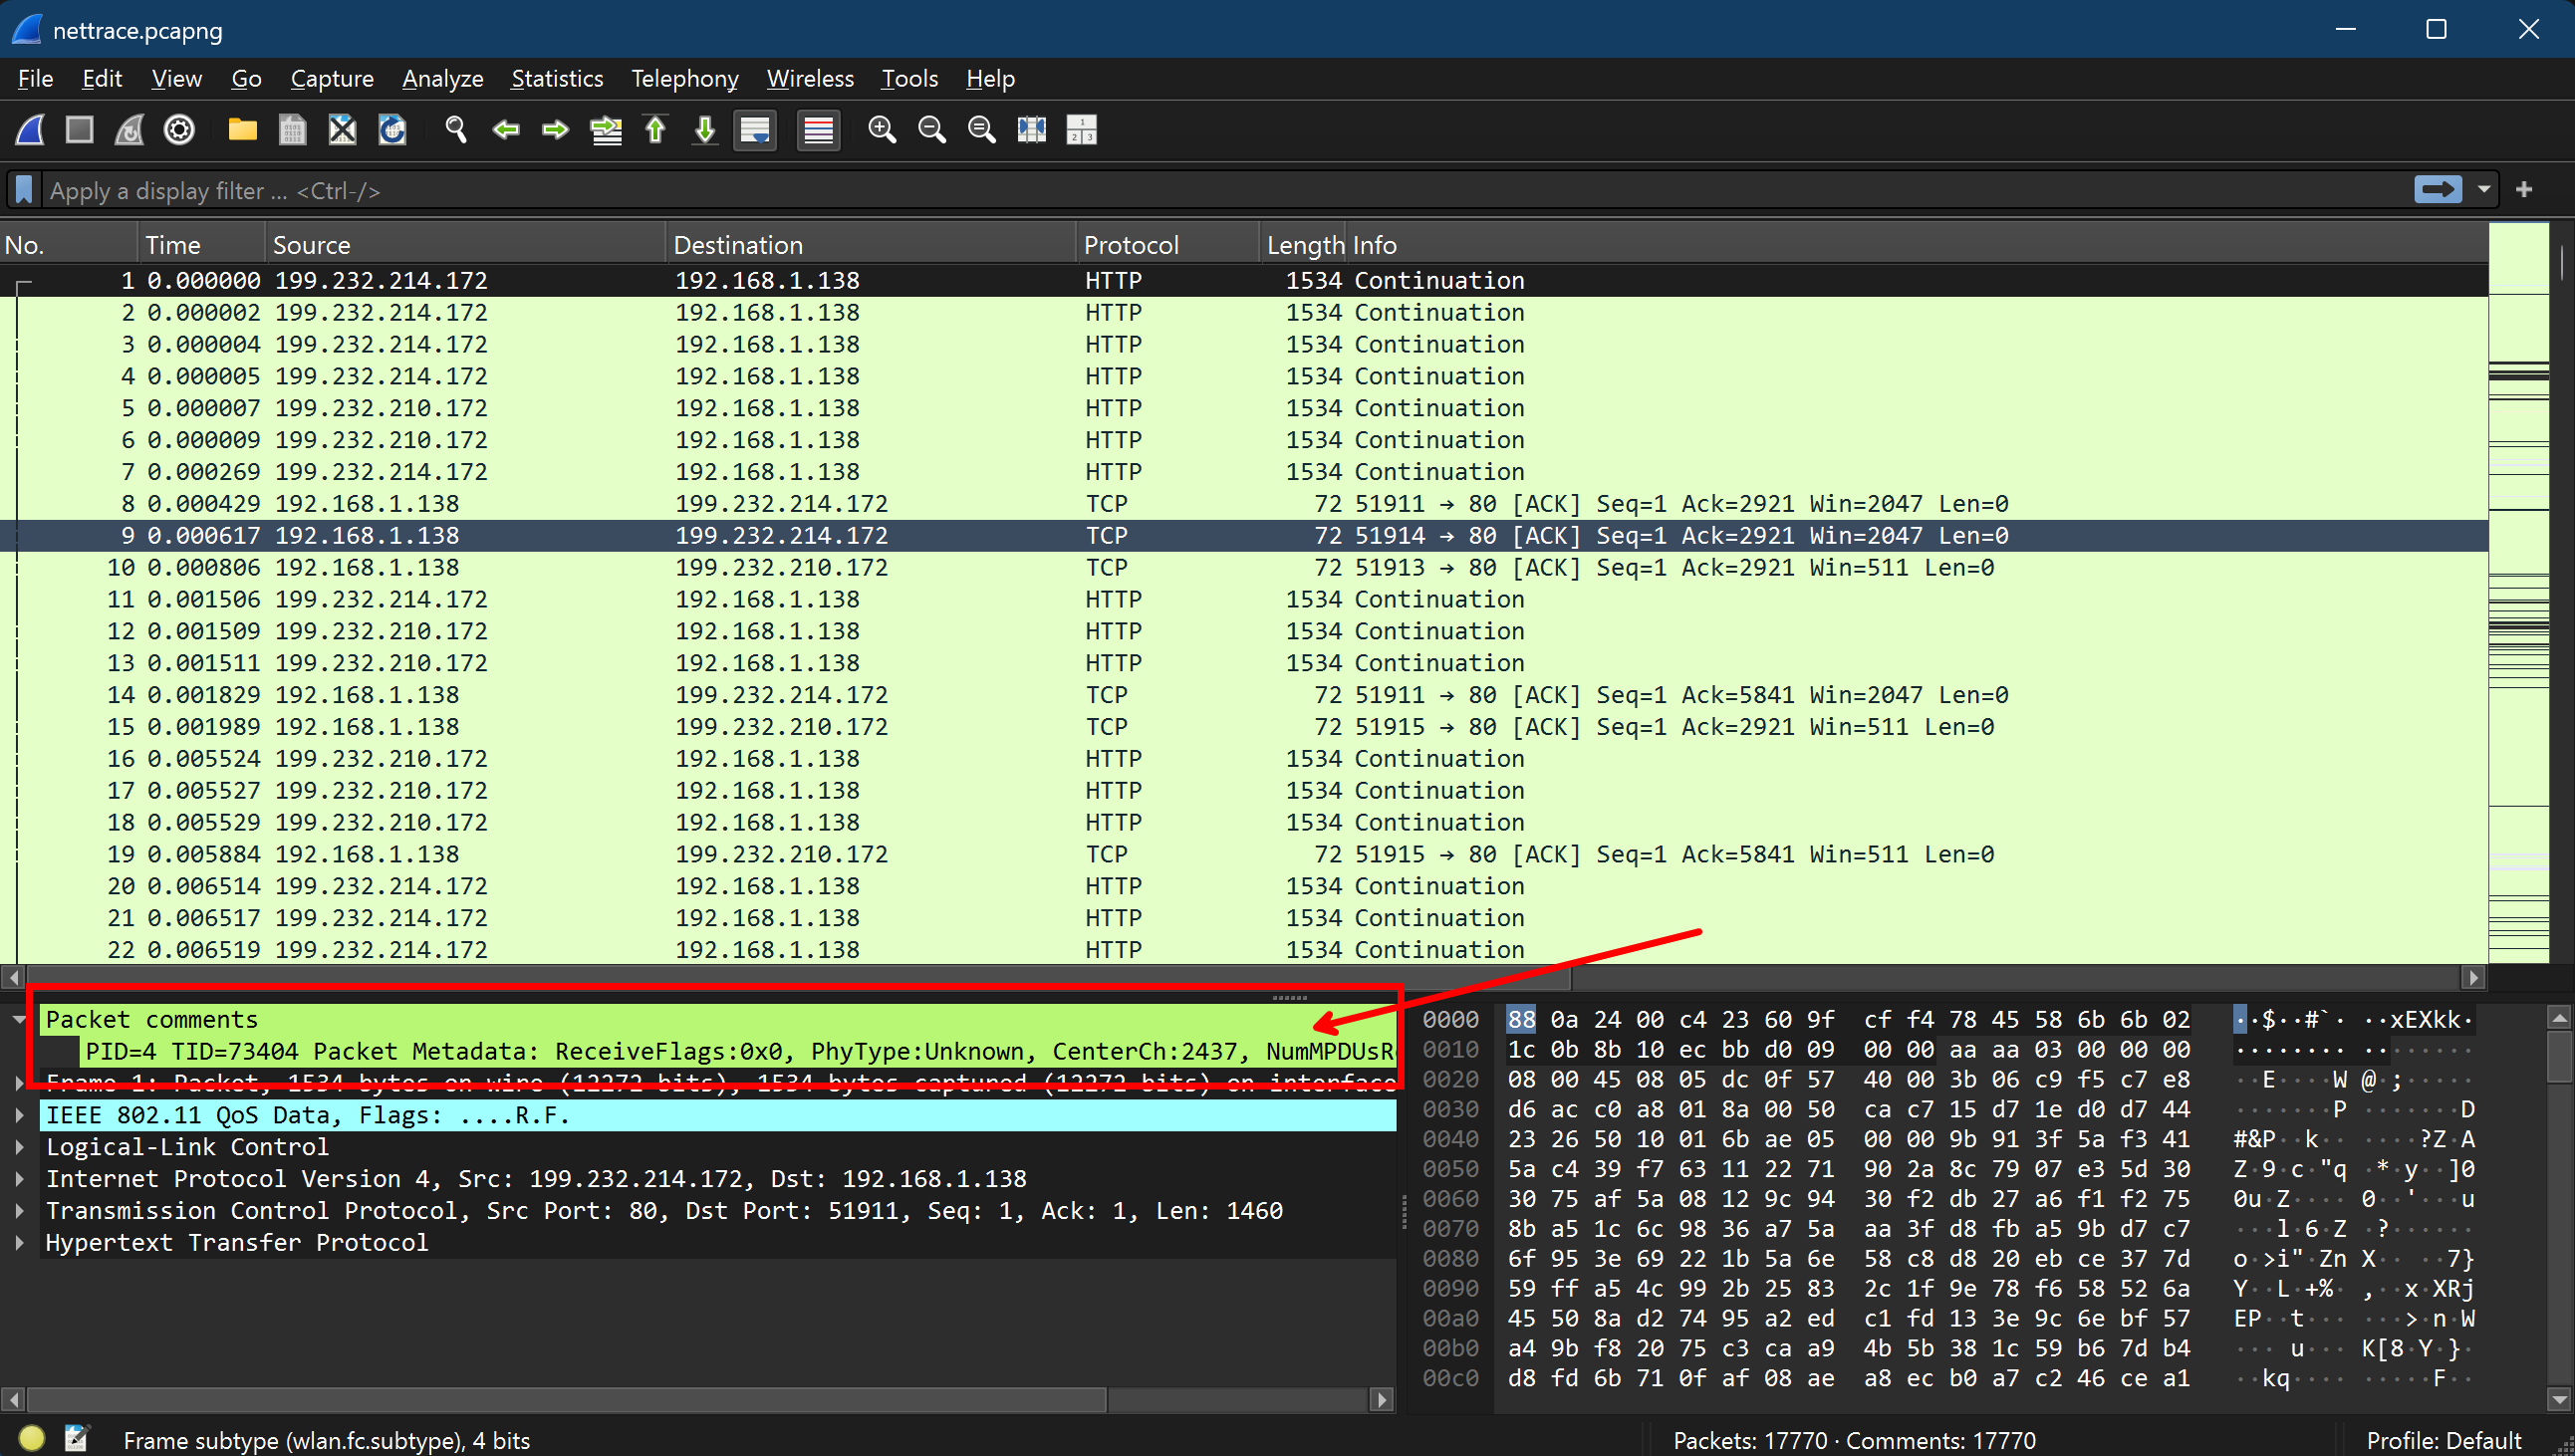
Apart from not having to install anything on the system using this method, you also have the advantage of having a more detailed capture, because netsh trace captures more than just the network traffic. It also captures additional information about the system and the processes, which can be very useful for troubleshooting and analysis:
This process works pretty well on every Windows system back to Windows 7 and Windows Server 2008 R2. Given that, this is pretty good for a built-in solution to get what you want.
Again, all this works without installing anything on the system, which is a huge advantage, especially on production servers. You can just run the commands, capture the traffic, and analyze it on your workstation with Wireshark without any installation on the server itself.
There are a lot more parameters and options available for netsh trace, which allow you to customize the capture process according to your needs. For example, you can specify
- protocol filters
- Ethernet types filters
- IP address filters
- specific interfaces to capture
- and much more
You can look at all the available options by running netsh trace show CaptureFilterHelp. This will give you a detailed list of all the available filters and options that you can use to customize your capture.
My personal favorites are:
# To capture only IPv4 traffic:
Ethernet.Type=IPv4

# To capture only TCP/UDP/ or both:
Protocol=TCP
Protocol=UDP
Protocol=(TCP,UDP)

# Cut down capturing to specific IP addresses:
IPv4.SourceAddress=<IPv4 address>
IPv4.DestinationAddress=<IPv4 address>
IPv4.Address=(<IPv4 Address>,<IPv4 Address>)
With these options, you should be equipped to effectively capture the most relevant traffic for your analysis and troubleshooting. You can combine the filters to capture only the traffic that is relevant to your specific use case, which can help you focus on the important data and reduce the noise in your capture.
You can find some examples in the section practical examples below.
2. pktmon - The new kid on the block
Pktmon is a newer built-in tool in Windows 10 / Windows Server 2019 and later that provides more convenient packet monitoring capabilities.
It is also a command-line tool that allows you to capture traffic, but it is more focused on packet monitoring than netsh trace and provides a bit more user-friendly interface for managing packet filters and capturing traffic. The syntax is a little different, but pretty much the same. If you are aware of netsh trace, you should feel comfortable using it. Here is a quick overview of the available commands in pktmon:
pktmon <command> [OPTIONS | help]
    Advanced packet capture and event collection.

Commands
    filter     Manage packet filters.
    list       List packet processing components.

    start      Start packet capture, counters, and event collection.
    stop       Stop data collection.
    status     Query current status.
    unload     Unload PktMon driver.

    counters   Display current packet counters.
    reset      Reset packet counters to zero.

    etl2txt    Convert log file to text format.
    etl2pcap   Convert log file to pcapng format.
    hex2pkt    Decode packet in hexadecimal format.

    help       Show help text for specific command.
               Example: pktmon start help
Because it also utilizes the Windows Event Tracing for Windows (ETW) framework to capture the network events, it also produces etl-files. So here is a quick example of how to use:
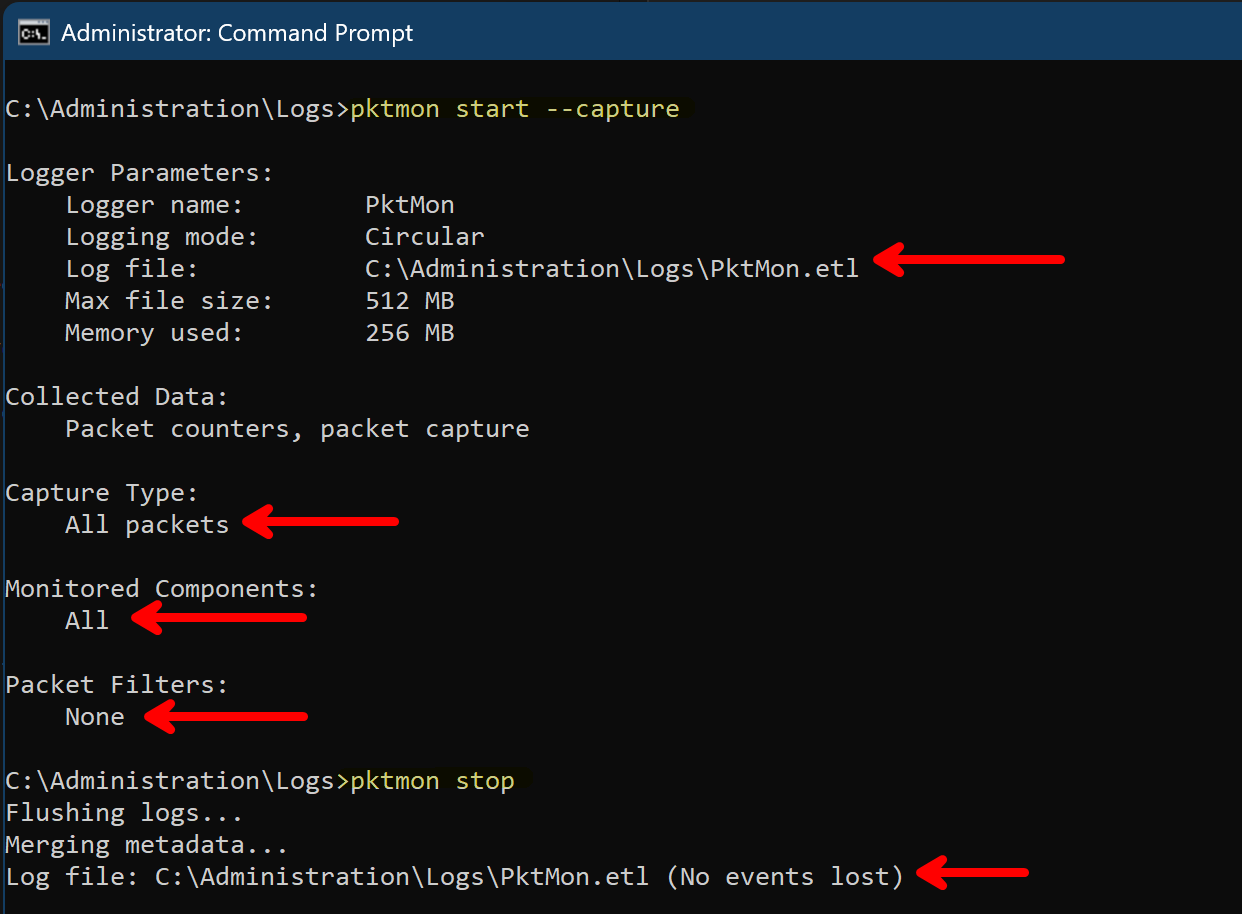
# Start capturing packets and save the output to a file
pktmon start --capture pktmon.etl

# Stop the capture
pktmon stop
As you might see, even if the syntax is a bit different than netsh trace, it comes pretty close. You can skip the reporting parameter, which is needed in its older counterpart. That makes it a bit shorter to call.
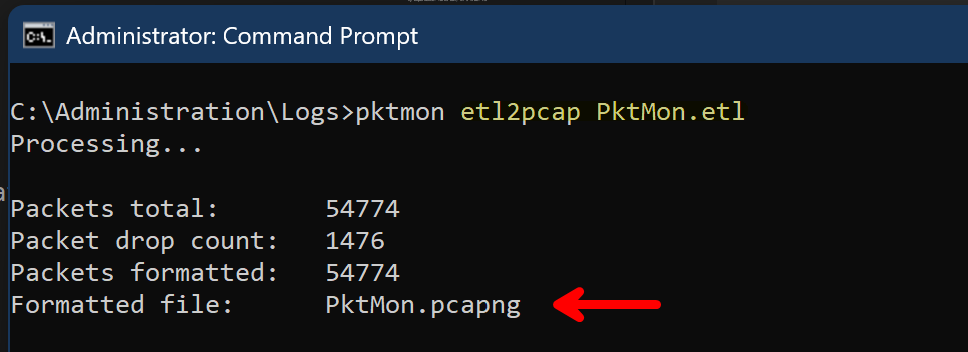
Here is a real advantage of pktmon: Unlike the classic netsh trace, the captured data can directly be converted to a .pcapng-file using the built-in capability of pktmon. That means, within a current operating system, you do not even need to use the additional tool etl2pcapng for the conversion.
You can directly convert the captured data to a .pcapng file for analysis with Wireshark:
# Convert the .etl file to .pcapng format
pktmon etl2pcap pktmon.etl
The created etl-file can be removed after the conversion, if you do not need it anymore. The pcapng-file is the one you will use for analysis in Wireshark. Because the pcapng file contains only the traffic data, and not so much additional information about the system and the processes, it is more lightweight than the etl file. But in case of a longer capture or high traffic, it can still be pretty big.
As outlined for netsh trace, pktmon provides a lot of filter options as well. Again, you can specify protocol filters, IP addresses, and much more to cut down your capture.
You can look at all the available options by running pktmon filter add help. This will give you a detailed list of all the available filters and options that you can use to customize your capture. The main difference is that you need to add the filters before starting the capture, which is a real difference from netsh trace, where you can specify the filters directly in the start command. But it may not be that big of a deal when you do this via scripts. In my opinion, this eases the readability of the command, as you do not have a lot of parameters in the start command, but it is more separated and structured.
Here are some examples of filters you can use with pktmon:
# To capture only IPv4 traffic:
pktmon filter add -p IPv4


# To capture only TCP/UDP/ or both:
pktmon filter add -p TCP
pktmon filter add -p UDP

# Cut down capturing to specific IP addresses:
pktmon filter add -a IPv4.SourceAddress <IPv4 address>
pktmon filter add -a IPv4.DestinationAddress <IPv4 address>
pktmon filter add -a IPv4.Address <IPv4 address>
The fact that you can execute the filter add commands multiple times to add multiple filters can be pretty useful, as it allows you to build up your filter configuration step by step and keep it more organized. You can also list the currently configured filters with pktmon filter list to see what filters are currently active before starting the capture.
3. Get-NetEventSession - The PowerShell native way
In case you are a PowerShell nerd, here is another way to capture network traffic using the Get-NetEventSession cmdlet, which is part of the NetEventPacketCapture module. This cmdlet allows you to create and manage network event sessions, which can be used to capture network traffic. Even though this requires a bit more text, PowerShell comes with capabilities that are quite interesting:
- Built-in tab-completion for parameters
- PowerShell remoting via built-in -CimSession parameters in the cmdlets
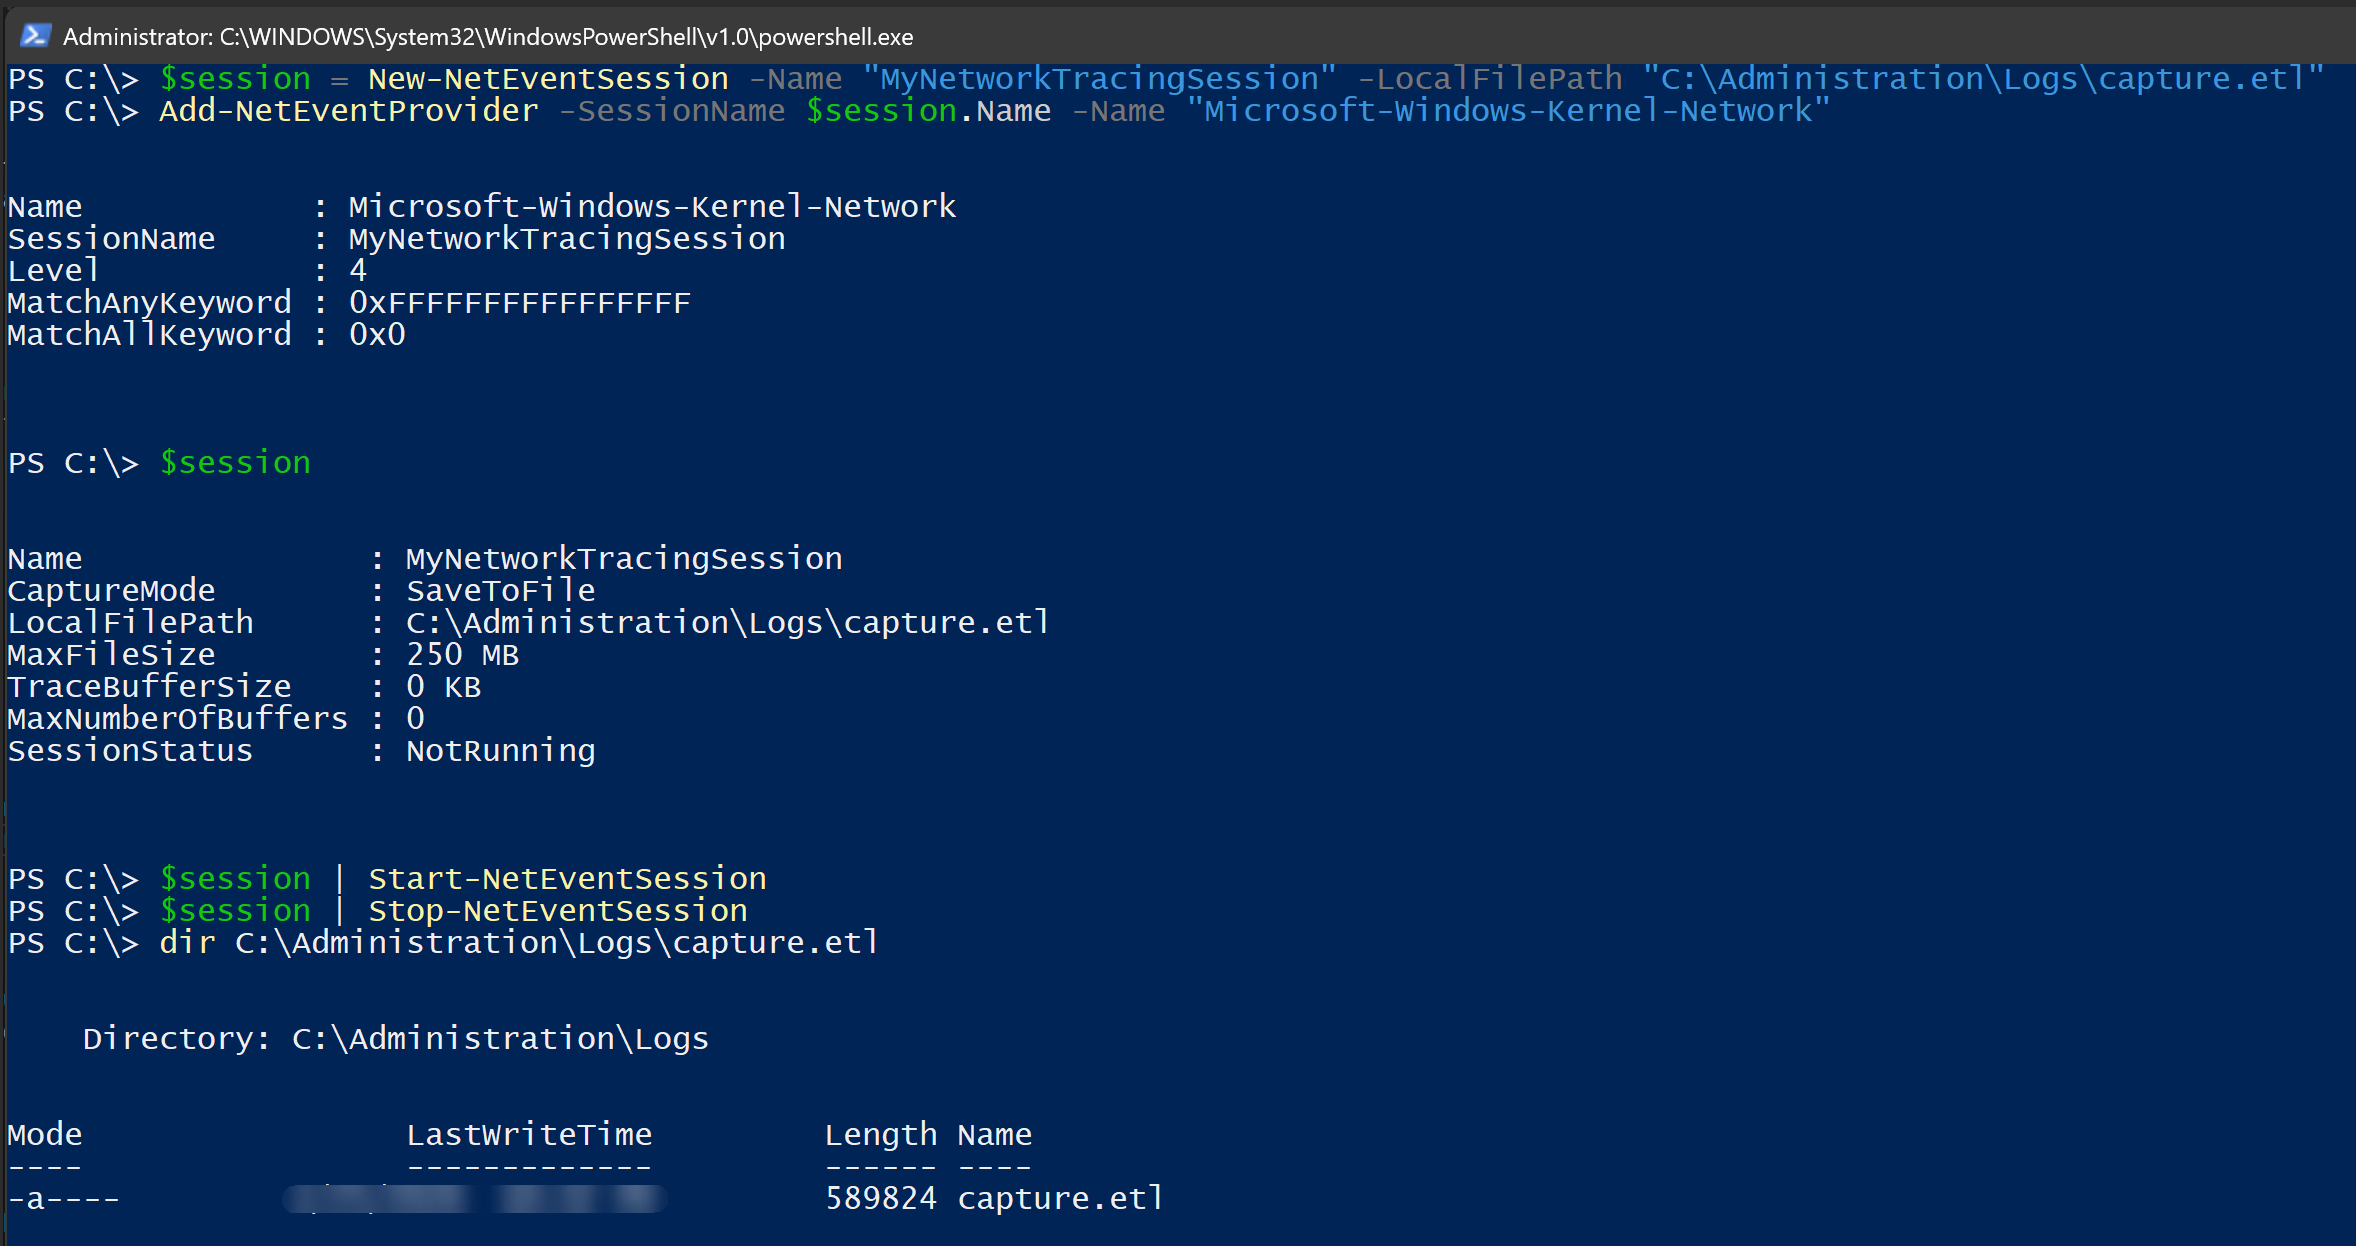
# Create a new network event session
$session = New-NetEventSession -Name "MySession" -LocalFilePath "C:\path\to\capture.etl"

# Add a provider to capture network traffic (e.g., Microsoft-Windows-Kernel-Network)
Add-NetEventProvider -SessionName $session.Name -Name "Microsoft-Windows-Kernel-Network"

# Check the created session
$session


# Start the session to begin capturing traffic
$session | Start-NetEventSession

# Stop the session to end the capture
$session | Stop-NetEventSession
In the same way as the command-line tools, the captured traffic is saved in a .etl file, which can be analyzed after conversion to .pcapng format using etl2pcapng or pktmon. I won’t outline this again, as it is the same process as described above.
I honestly have to admit that this is not my favorite way to capture network traffic, as it is a bit complex dealing with the various commands and the underlying concepts of network event sessions and providers. But if you want to stay fully in a PowerShell-only world, it is still a built-in and powerful way to capture traffic.
In the practical example section below, you will find an example where I used the PowerShell remoting capabilities to capture network traffic on a remote system combined with the command-line tools from above. This is a pretty powerful combination and in my personal opinion, there is nothing against using command-line tools in combination with PowerShell. As is often the case… use what fits best for you and your use case. There is no one-size-fits-all solution.
Although, of course, ❤️ PowerShell ❤️ is pretty close to a one-size-fits-all solution. 😁
4. The GUI way: Performance Monitor
If you prefer a classical and MMC based graphical user interface within Windows, you can use the built-in Performance Monitor (PerfMon) as well. PerfMon allows you to create data collector sets that can capture various performance metrics, including network traffic.
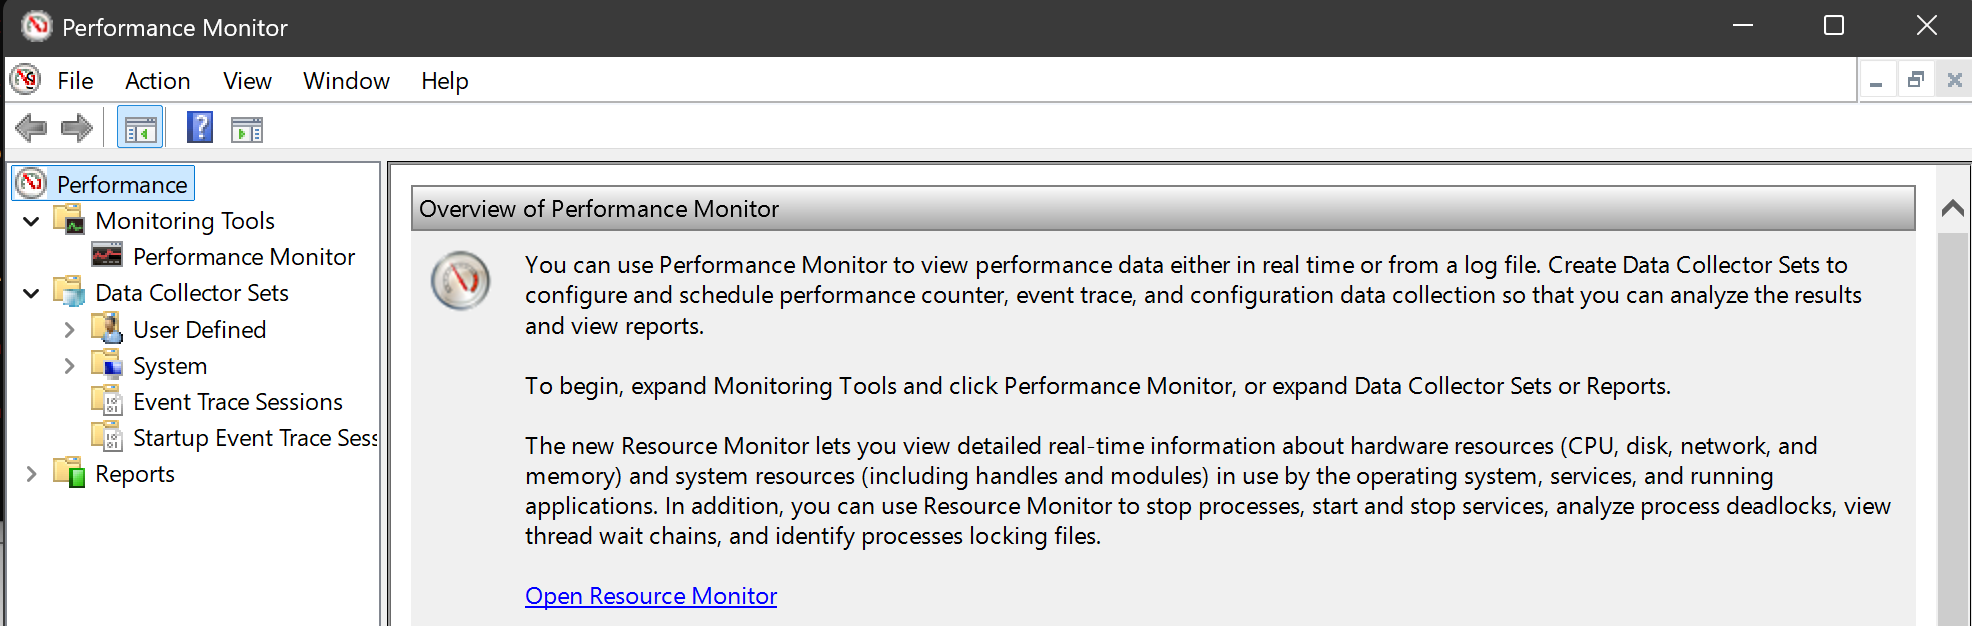
Effectively, all of the above mentioned tools are based on the same underlying technology, the Windows Event Tracing for Windows (ETW) framework, and they just provide different interfaces and with different capabilities to capture events. The Performance Monitor is just the GUI based interface for ETW.
To capture network traffic using Performance Monitor, you can follow these steps:
- Open Performance Monitor by typing
perfmonin the Start menu and pressing Enter. - In the left pane, expand “Data Collector Sets” and right-click on “User Defined”. Select “New” > “Data Collector Set”.
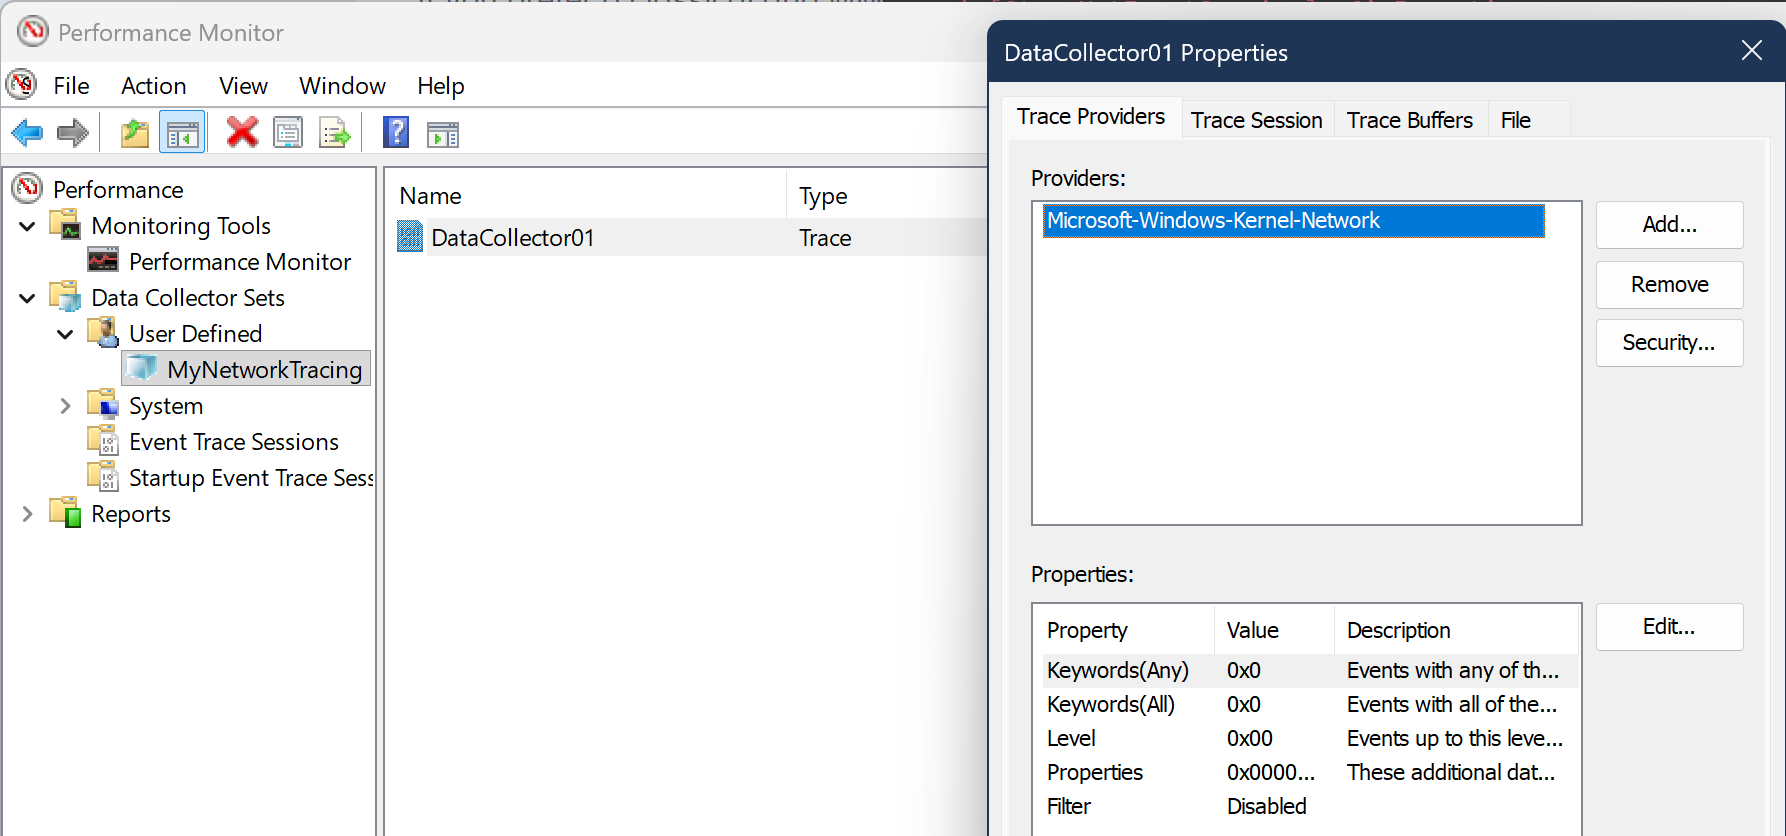
- Give your data collector set a name (e.g., “NetworkTrafficCapture”) and select “Create manually (Advanced)”. Click “Next”.
- In the “Create Data Collectors” step, select “Performance counter” and click “Next”.
- Click “Add” to add performance counters. In the “Add Counters” dialog, expand “Network Interface” and select the counters you want to capture (e.g., “Bytes Total/sec”, “Packets/sec”). Click “Add” and then “OK”.
- Click “Next” and specify the location where you want to save the captured data. Click “Next” and then “Finish” to create the data collector set.
- To start capturing network traffic, right-click on your newly created data collector set (e.g., “NetworkTrafficCapture”) and select “Start”. The performance counters will start capturing data.
- To stop the capture, right-click on the data collector set again and select “Stop”. The captured data will be saved in the specified location.
This is a particularly useful method if you want to capture performance metrics related to network traffic via different schedules and over a longer period of time. It is not the best method for a quick capture and analysis, but it can be very useful for monitoring and analyzing network performance over time.
In addition to the scheduling, such defined data collector sets can easily be exported and imported on other systems, which can be very useful for standardizing the capture process across multiple servers or workstations. This is especially useful if you combine various metrics together with the network traffic capture, like CPU usage, memory usage, disk I/O, etc., to get a more comprehensive view of the system’s performance and behavior in relation to the network traffic.
I am not going into more details on this, because the main intention on this blog post is to show how to capture quickly and in the console.
Practical Example
Capture only HTTP or HTTPS traffic
This may be a common use case.
Unfortunately, as far as I know, there is no built-in capability in netsh trace start to capture specific ports. 😣 The filters do not allow you to be that specific. But with pktmon you can easily do this. Well, it’s worth mentioning that this is only possible within Windows Server 2019 and Windows 10+ versions later than 1809.
You can use the following command to capture only HTTP and HTTPS traffic:
pktmon filter add "http + https" -d IPv4 -t TCP -p 80 443
pktmon start --capture --file-name https_traffic.etl

pktmon stop
pktmon filter remove
Capture only DNS traffic
If you are only interested in capturing DNS traffic, you can use the following command to capture only DNS traffic:
pktmon filter add "UDP DNS" -d IPv4 -t UDP -p 53
pktmon filter add "TCP DNS" -d IPv4 -t TCP -p 53
pktmon start --capture --file-name dns_traffic.etl

pktmon stop
pktmon filter remove
Capture only SMTP traffic
If you want to capture only SMTP traffic, you can use the following command to capture only SMTP traffic:
pktmon filter add "SMTP" -d IPv4 -t TCP -p 25
pktmon start --capture --file-name smtp_traffic.etl

pktmon stop
pktmon filter remove
This is just another quick example of how you can use the filtering capabilities of `pktmon` to capture only specific types of traffic.
Capture via netsh trace with specific IP
If you are forced to use netsh trace, because of older operating systems or prefer to use it, I’d recommend specifying ip-filter to your system’s IP. This way you cut broadcast and other traffic that is probably not related to your system.
First Prepare your IP filter and the file path for the capture:
$localIpList = (Get-NetIPAddress -AddressState Preferred -PrefixOrigin Dhcp, Manual -AddressFamily IPv4).ipaddress
$ipFilter = "($($localIpList -join ","))"
$filePath = "traffic.etl"
Then start the capture with the IP filter:
netsh trace start capture=yes report=disabled overwrite=yes fileMode=circular Protocol="(UDP,TCP)" tracefile="$($filePath)" IPv4.Address=$ipFilter
Check the status of the capture:
netsh trace show status
Do your thing, and when you are done, stop the capture:
netsh trace stop
With this approach, you can easily capture only the traffic that is relevant to your system, which can help you to focus on the important data and reduce the noise in your capture. This is especially useful in environments with a lot of network traffic, where capturing everything would result in a very large and unwieldy capture file.
Capture traffic via PowerShell remoting
I would like to outline another practical use case that I have used in real life multiple times. When it comes to bigger environments with multiple servers, it is not really efficient to log in to each server and execute capture commands one by one.
This is exactly where PowerShell remoting comes to shine. 🎉
You can combine the PowerShell remoting capabilities with the command-line tools from above to easily capture traffic on an arbitrary number of systems. I’d consider this a pretty powerful combination!
Here is a quick example of how to do this:
(For the obvious, you can customize the script blocks to include additional filters or parameters as needed for your specific use case)
# Define the list of remote servers you want to capture traffic on
$remoteServers = @("Server1", "Server2", "Server3")

# Define the base path and filename on the remote servers
$remoteBasePath = "C:\Administration\Logs"
$remoteCaptureFileName = "traffic_http"

# Create session to the remove servers
$sessions = New-PSSession -ComputerName $remoteServers

# Define the script block to start capturing network traffic using pktmon
$scriptStart = {
    $filePath = "$($using:remoteBasePath)\$($using:remoteCaptureFileName)_$($env:COMPUTERNAME)_$(Get-Date -Format 'yyyy-MM-dd-HH-mm-ss').etl"

    PktMon.exe filter add "HTTP" -d IPv4 -t TCP -p 80
    PktMon.exe start --capture --file-name "$($filePath)"
}

# Execute the script block on each remote server using PowerShell remoting
Invoke-Command -Session $sessions -ScriptBlock $scriptStart
Now, do your thing to get what you want…
You can check the status of the capture on each remote server with the following command:
Invoke-Command -Session $sessions -ScriptBlock { PktMon.exe status }
When you are good to go, you can stop the capture and convert the captured data to .pcapng format on each remote server with the following command:
$scriptStop = {
    # Stop the capture
    PktMon.exe stop | Out-Null

    # Remove the filters (to be clean for the next capture)
    PktMon.exe filter remove | Out-Null

    # Convert the .etl file to .pcapng format
    PktMon.exe etl2pcap $filePath

    # Purge the original .etl file after conversion
    Remove-Item -Path $filePath -Force
}
Invoke-Command -Session $sessions -ScriptBlock $scriptStop
Now, you have captured the traffic on each remote server, but in the same way, you have a capture file on each server. Luckily, PowerShell helps you in this situation as well. You can use the same remoting capabilities to copy the captured files to your local workstation for analysis with Wireshark. You can use the Copy-Item cmdlet with the -ToSession parameter to copy the files from the remote servers to your local machine.
# Define the local path where you want to save the captured files
$localPath = Join-Path -Path $home -ChildPath "LocalData"

# Copy the captured files from each remote server to the local machine
foreach ($session in $sessions) {
    $remoteFilePath = "$($remoteBasePath)\$($remoteCaptureFileName)_*.pcapng"
    Copy-Item -Path $remoteFilePath -Destination $localPath -FromSession $session
}

# Purge the pcapng files from the remote servers after copying
Invoke-Command -Session $sessions -ScriptBlock {
    Remove-Item -Path ($filePath -replace ".etl", ".pcapng") -Force
}
When you are done, remove the sessions to the servers:
# Remove the sessions to the remote servers
Remove-PSSession -Session $sessions
As this example shows, you can easily capture network traffic on multiple systems, by **combining `PowerShell` and `pktmon`**. This approach allows you to efficiently manage and analyze network traffic across your environment without the need for manual intervention or installing anything on the remote servers. This example assumes you have systems with - more or less - current versions of Windows. In case `pktmon` is not available on your systems, just replace the `pktmon` commands with the somehow corresponding `netsh trace` commands.
See the netsh examples from above to get ideas how to use it. The overall structure of the script blocks will remain the same.
Conclusion
Capturing network traffic in Windows can EASILY be done using various built-in tools, each with its own advantages and use cases. Whether you prefer command-line tools like netsh trace and pktmon, or a graphical interface like Performance Monitor, there are options available to suit different needs and preferences.
For quick captures and analysis, pktmon is a great choice due to its ease of use and direct conversion capabilities. (If you are on Windows Server 2019 or Windows 10+ version later than 1809) On older systems, netsh trace can be a powerful tool that -does the job- as well.
And for those who prefer a GUI, Performance Monitor provides a comprehensive way to capture and analyze network performance metrics. Ultimately, the best tool for capturing network traffic in Windows depends on your specific requirements and the level of detail you need for your analysis.