
Andi Bellstedt
Friday, April 3, 2026 | 28 minutes
DNS Server Debug Logging
What is this about?
As the name implies, this article is about the debug logging capabilities of Windows DNS Server. So, by reading this article, you get information about how to gain insights into the name resolution processes in your environment. This can be very helpful for troubleshooting and analysis of DNS-related issues. Before going into the details, let’s first understand what DNS Server Debug Logging is and why it -sometimes- is an important thing and a practical helper.
In a lot of cases, the DNS Server is a role on the Domain Controller in an Active Directory environment. In every case, the DNS Server is a critical component of the network infrastructure. Name resolution is everywhere and is a fundamental part of how computers communicate on a network.
But what happens when something goes wrong, or if this critical component needs to be touched for any reason? This can happen for various reasons, such as:
- Troubleshooting - Someone reports issues with name resolution. From time to time, wrong IP addresses are returned to a client and an application stops working.
- Migration and Change Management - Servers may need to be migrated somewhere else. Maybe to a new network segment, into a hyperscaler, or simply the organization decided to transfer DNS from Active Directory to network appliances. Clients may need to be reconfigured at this point to target the new DNS server.
- Statistics and (Security) Analysis - Who is asking for what? What kind of patterns can be observed? What kind of requests are being made? Are there any suspicious activities?
In such cases, having insights into name resolution details can be invaluable. This article tries to cover some ways to get those insights. Just to mention, by talking about a “DNS-client”, I mean any device that is asking for name resolution, like a workstation, a server, a printer, IT infrastructure devices, or even an IoT device.
Capabilities for Windows DNS Server insights
When it comes to the question of “How to get the stuff out of the DNS Server?”, there are several options available.
 Let’s have a look at the most common ones:
Capability - Network Packet Capturing
Classic and Powerful. Maybe not the long term solution, but for quick troubleshooting or real-time analysis, it is totally valuable. I wrote about this in my last article Capture Network Traffic in Windows, so I will not go into details here.
Capability - Firewall Logging
In case you have a segmentation of your network in place and you have access to the firewall logs, you can get information about who is communicating for DNS -and all the other services- from there. This is not the most detailed information, because it lacks granularity and the service-specific details, but it can be helpful and a quick win if it is already in place. This may not be an option if you have flattened networks, there is probably no firewall between the DNS-Clients and the DNS-Server. You can use the local Windows-Firewall anyway, but as you may see in the next sections, there are better options in that case. Then there is unfortunately the prohibiting case of “organizational silos” and “lack of communication” between teams, where it simply may not be feasible to get the firewall logs, even if they exist.
Capability - EventLogs
Hopefully you have the EventLog configuration to log All Events in place on your DNS Server. If not, now is the time to set it up, because it is a good starting point for operational logging in your Windows DNS service.
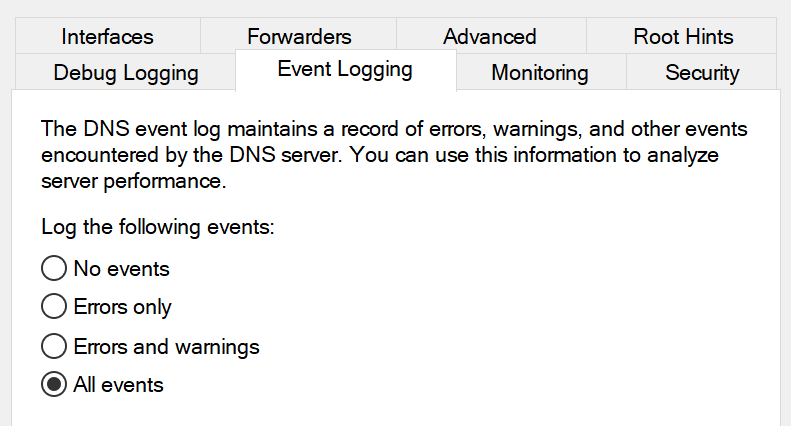
It may not be the most detailed information, but it produces basic insights in the classical Windows Event Logs.
Apart from the classic Windows Event Logs, there are also some DNS Server specific application logs available. Many know the “DNS Server” log in the “Application and Services Logs” section of the Event Viewer, but they are not that interesting for real insights into the service.
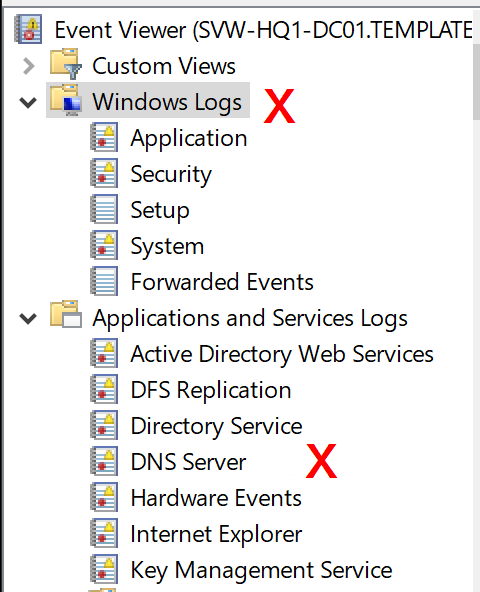
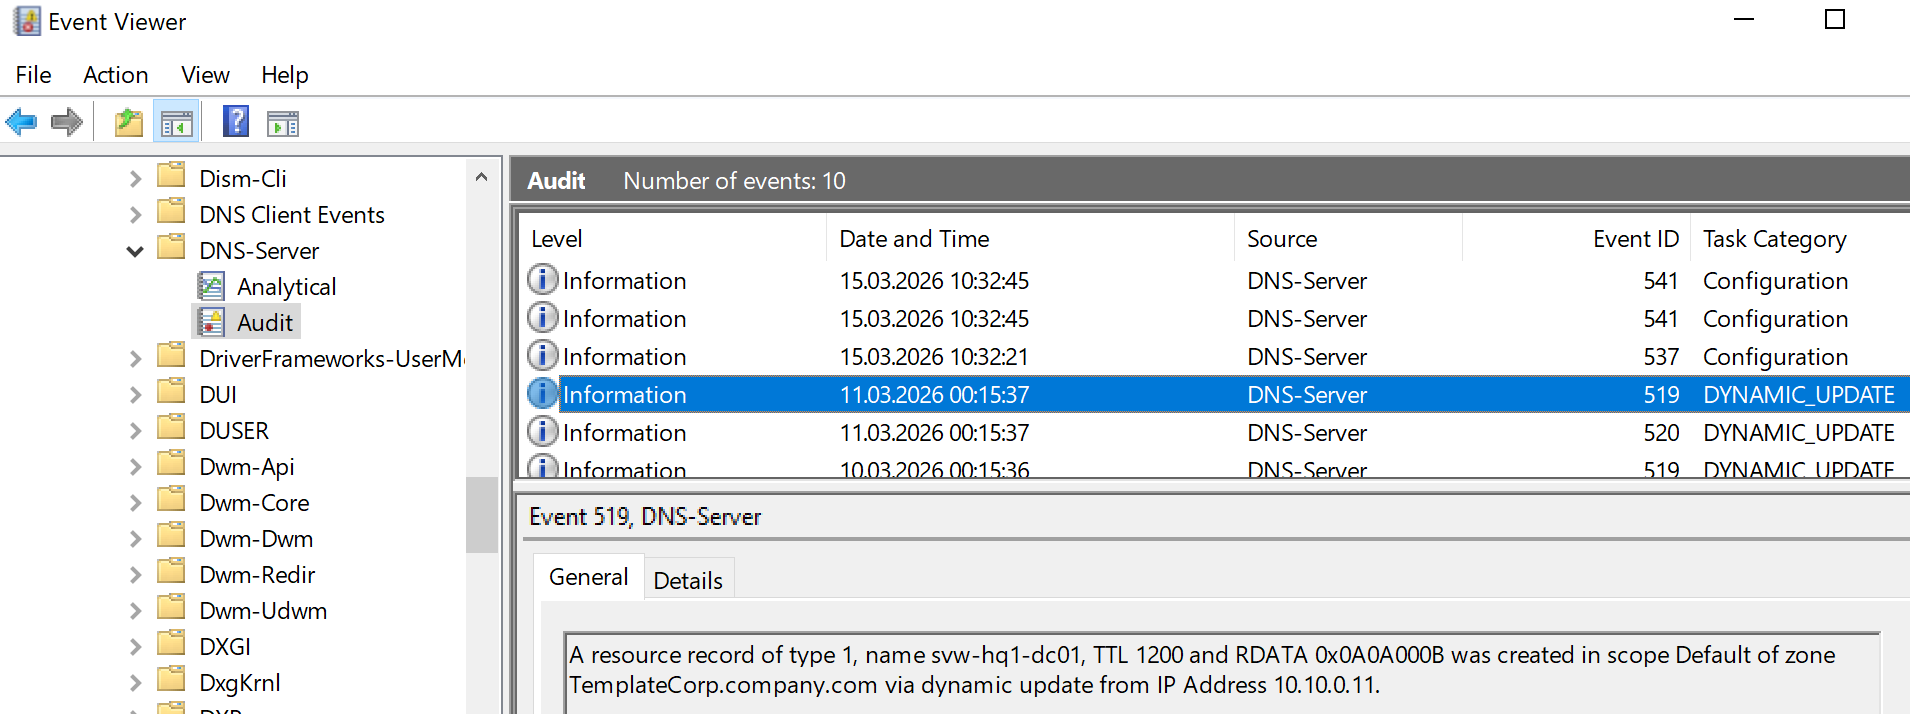
Effectively, there are two more DNS Server EventLogs available down in the folder structure. The Audit log that provides operational information what kind of operations are occurring in the DNS Server:
 On the other hand, there is a less known Analytical log that can be activated on-demand. It provides very detailed information about the ongoing name resolution processes, like what kind of queries are being made, what kind of responses are being sent, and so on.
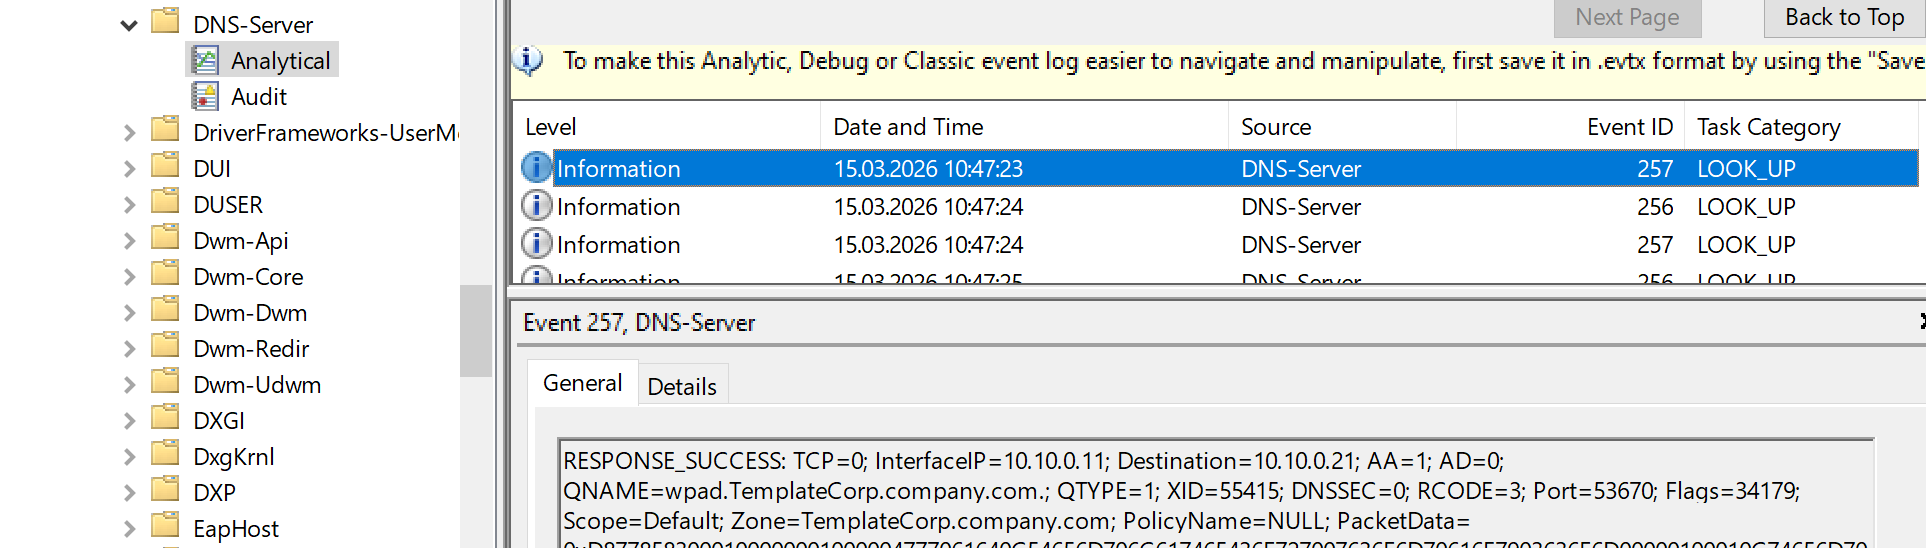 This log is not active by default, but it can be enabled for troubleshooting and analysis purposes. Unfortunately, as far as I know, the “Analytical” log is not able to roll over into several files, so it may be tricky to use it for a longer-term approach. For short-term troubleshooting or analysis, it may be a choice.
Capability - EventTracing
Windows Event Tracing (ETW) is probably the most powerful option when you want to go deep into Windows internals. Unfortunately, it is also the most complex one, and it is not very user-friendly. I may cover ETW explicitly in a future article, but for now, I will not go into details here.
Capability - DebugLogFile
The Windows DNS Server also has a built-in text-based debug logging that can be configured easily. This feature allows you to log the same details as the “Analytical” Event Log, but it writes into text files and provides roll-over capabilities, so it can be used for a longer-term approach.
It may be a bit more user-friendly than ETW, because it provides readable text without the need for PerfMon and the other ETW tools. The format of the logfile, however, is not perfectly structured, but it is still possible to consume the information with some effort.
How to set up the logging
Now that we have the options on the table, let’s have a look at how to set this up. As mentioned before, I will not cover packet capturing, firewall logging, nor EventTracing here, but let’s take a look at the EventLogs and the DebugLogFile.
Configure the Analytical EventLog
As already mentioned before, the “Analytical” Event Log is not active by default. Even more, it is not visible by default. First things first, let’s navigate to the relevant Service Logs section in the Event Viewer.
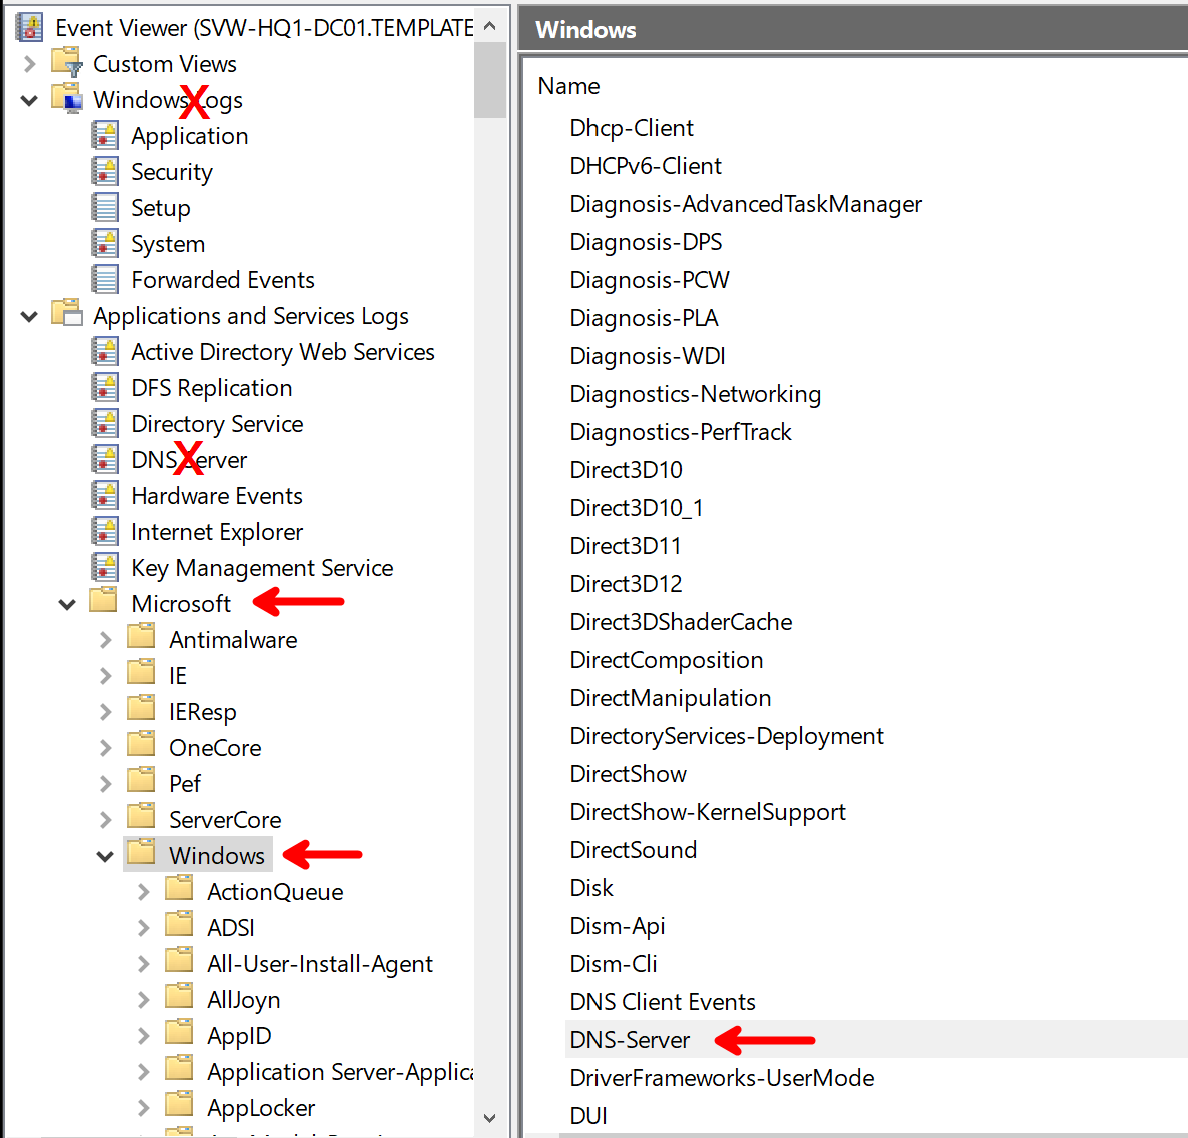
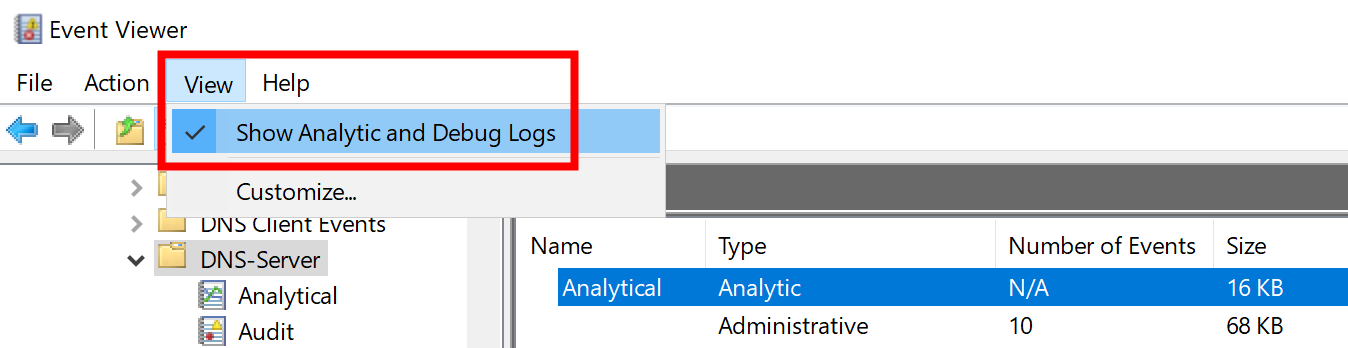
In there, you need to enable analytical and debug logs for the DNS Server.
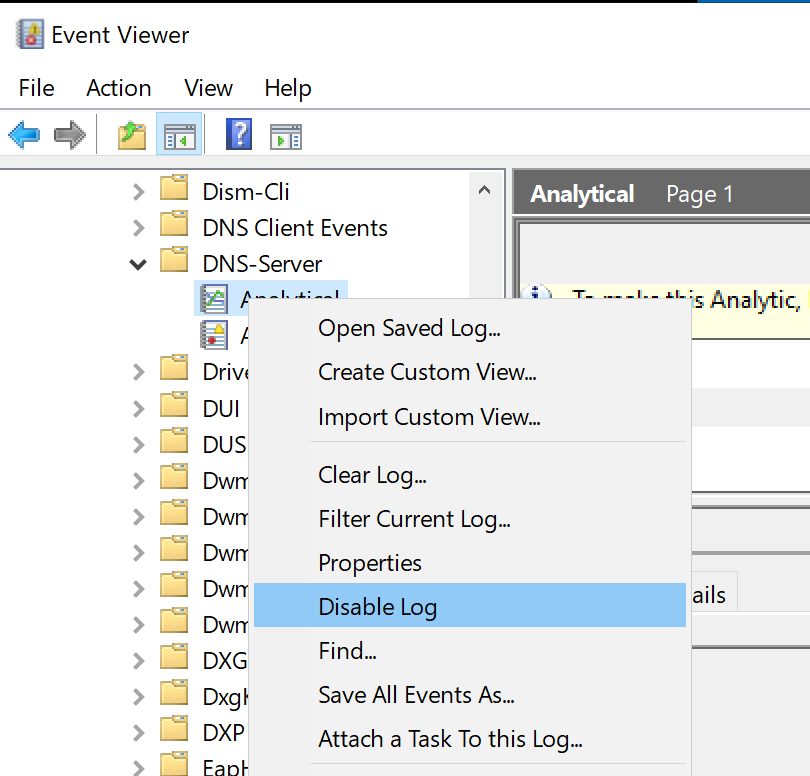
Afterwards, the log is still disabled and will not show any entries, so you need to enable the log.
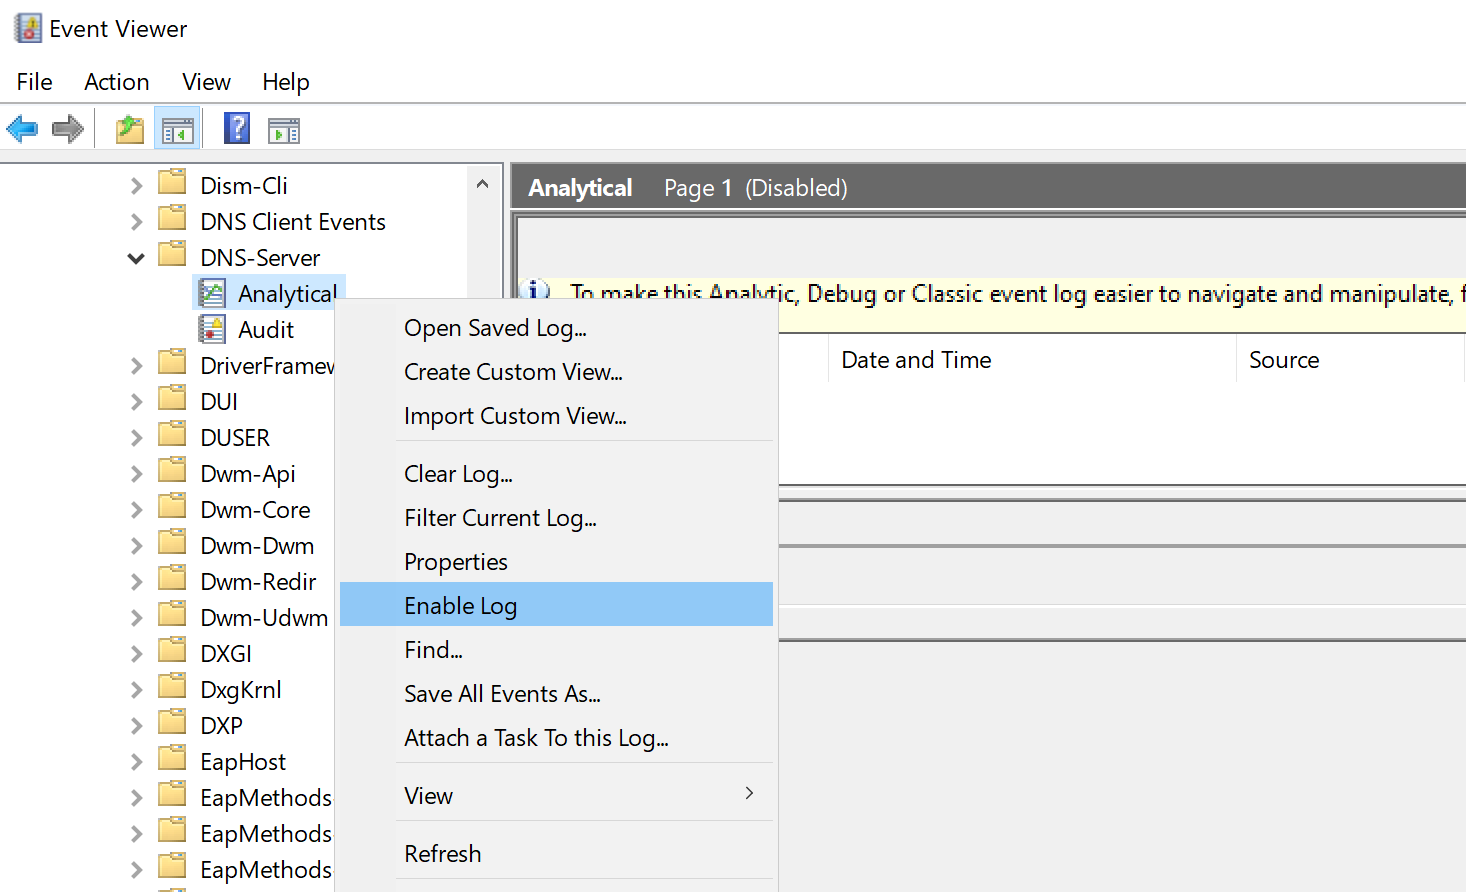
For anyone who does not want to follow click-ops, here is the command line to enable the analytical log:
wevtutil set-log "Microsoft-Windows-DNSServer/Analytical" /e:true
By enabling the log, the server will start to capture information. Please be aware that there is no live view of the captured events in the log. The data gathering needs to be stopped by disabling the log again, and then you can see the captured events.
wevtutil set-log "Microsoft-Windows-DNSServer/Analytical" /e:false
Afterwards, you can see the captured events in the log:
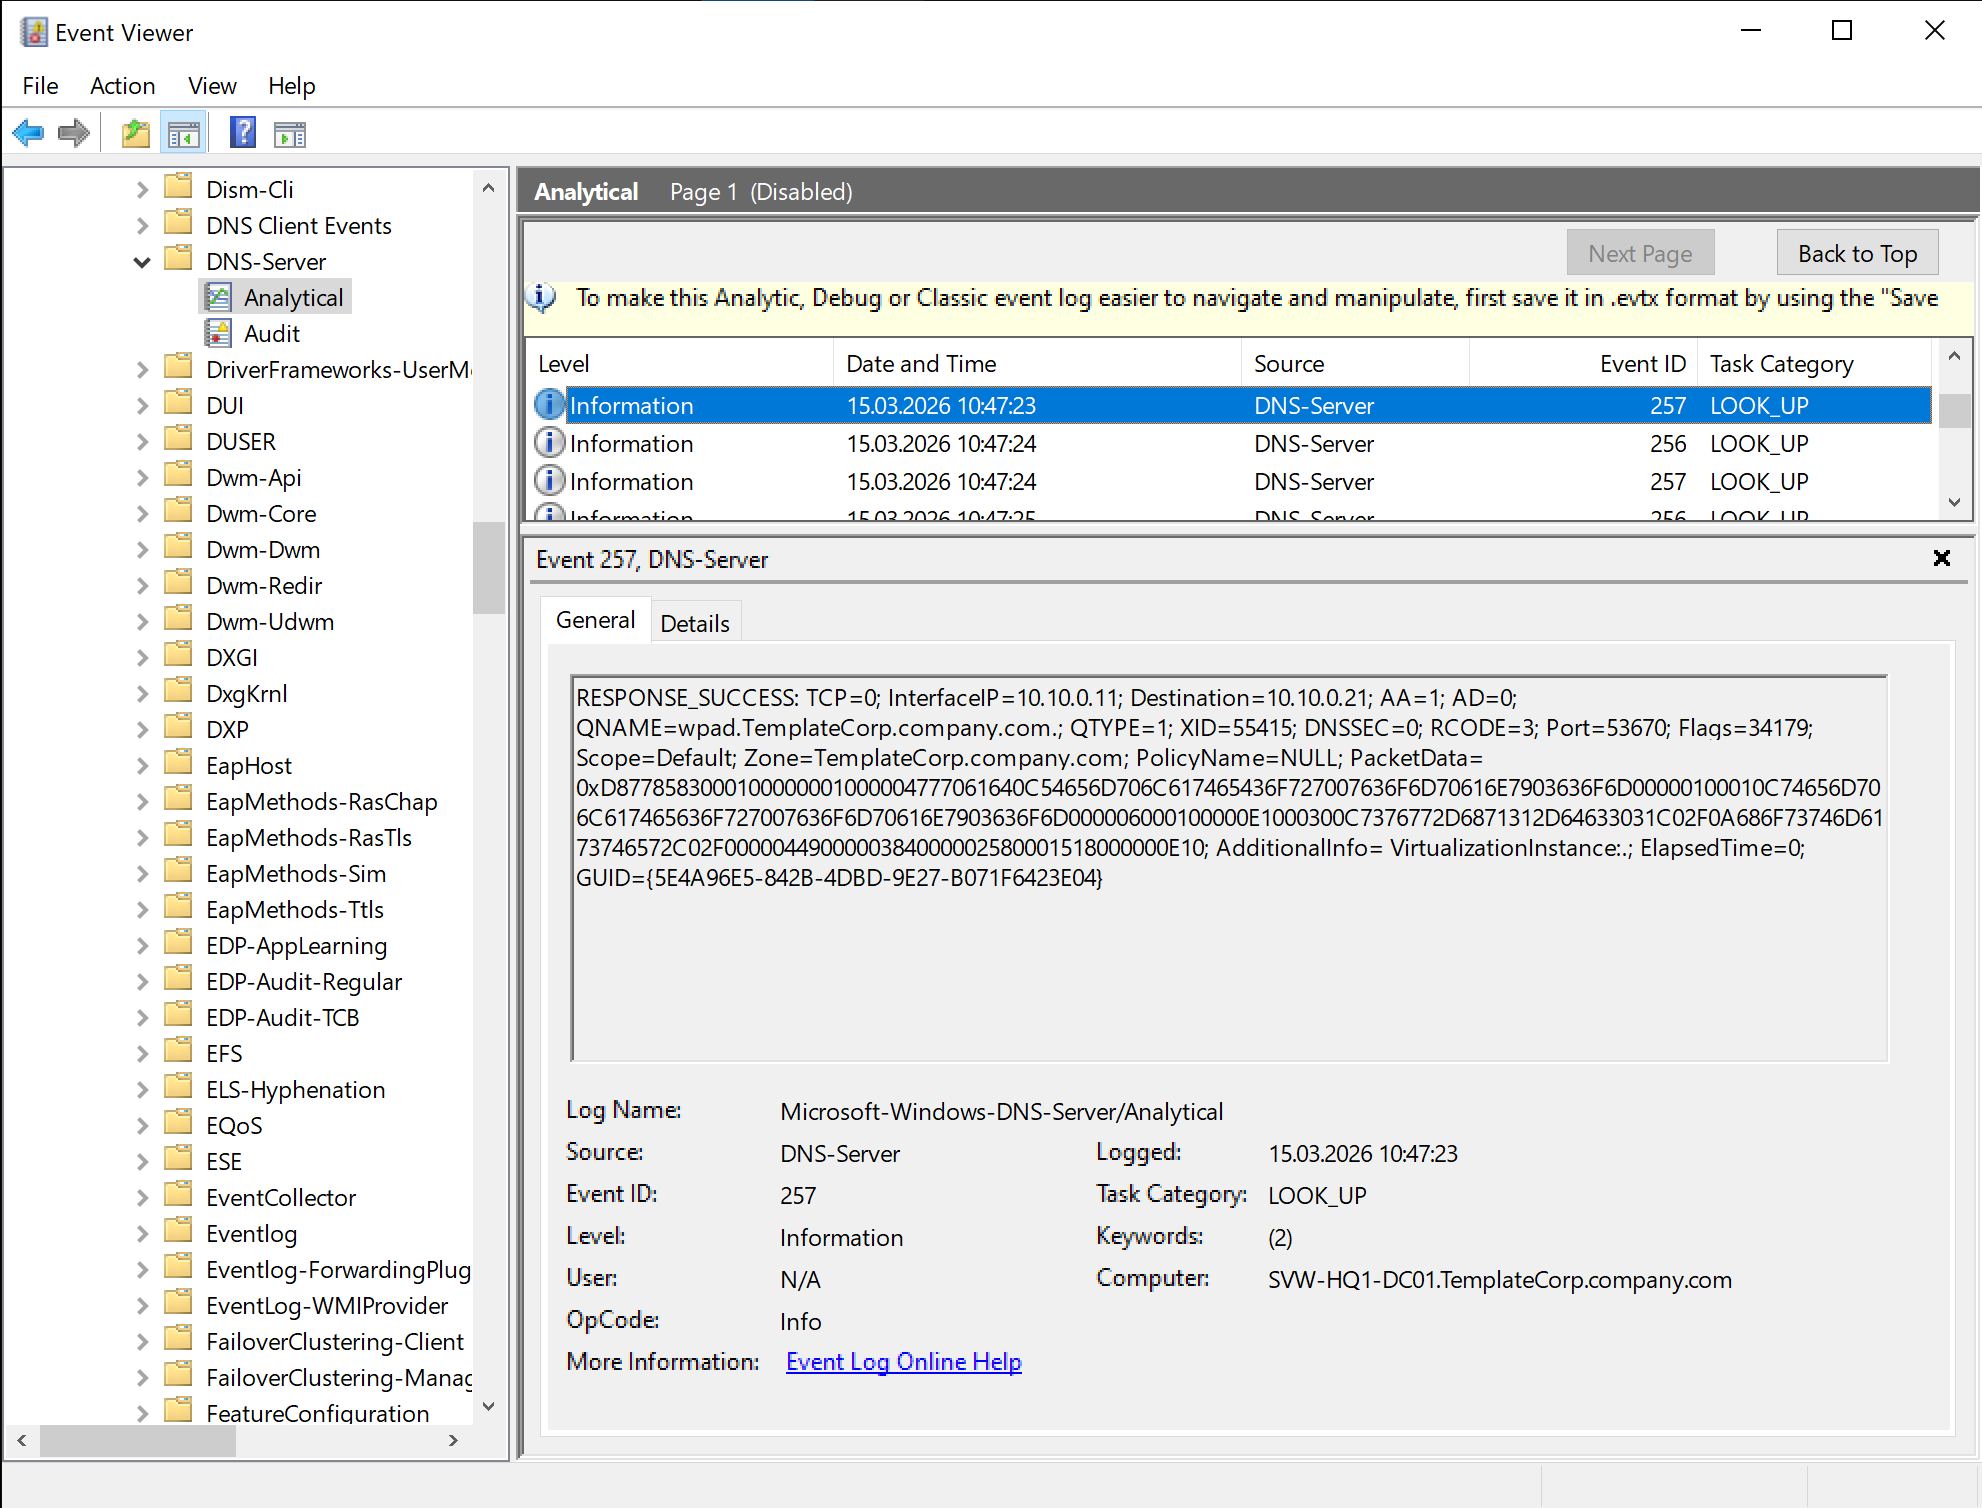
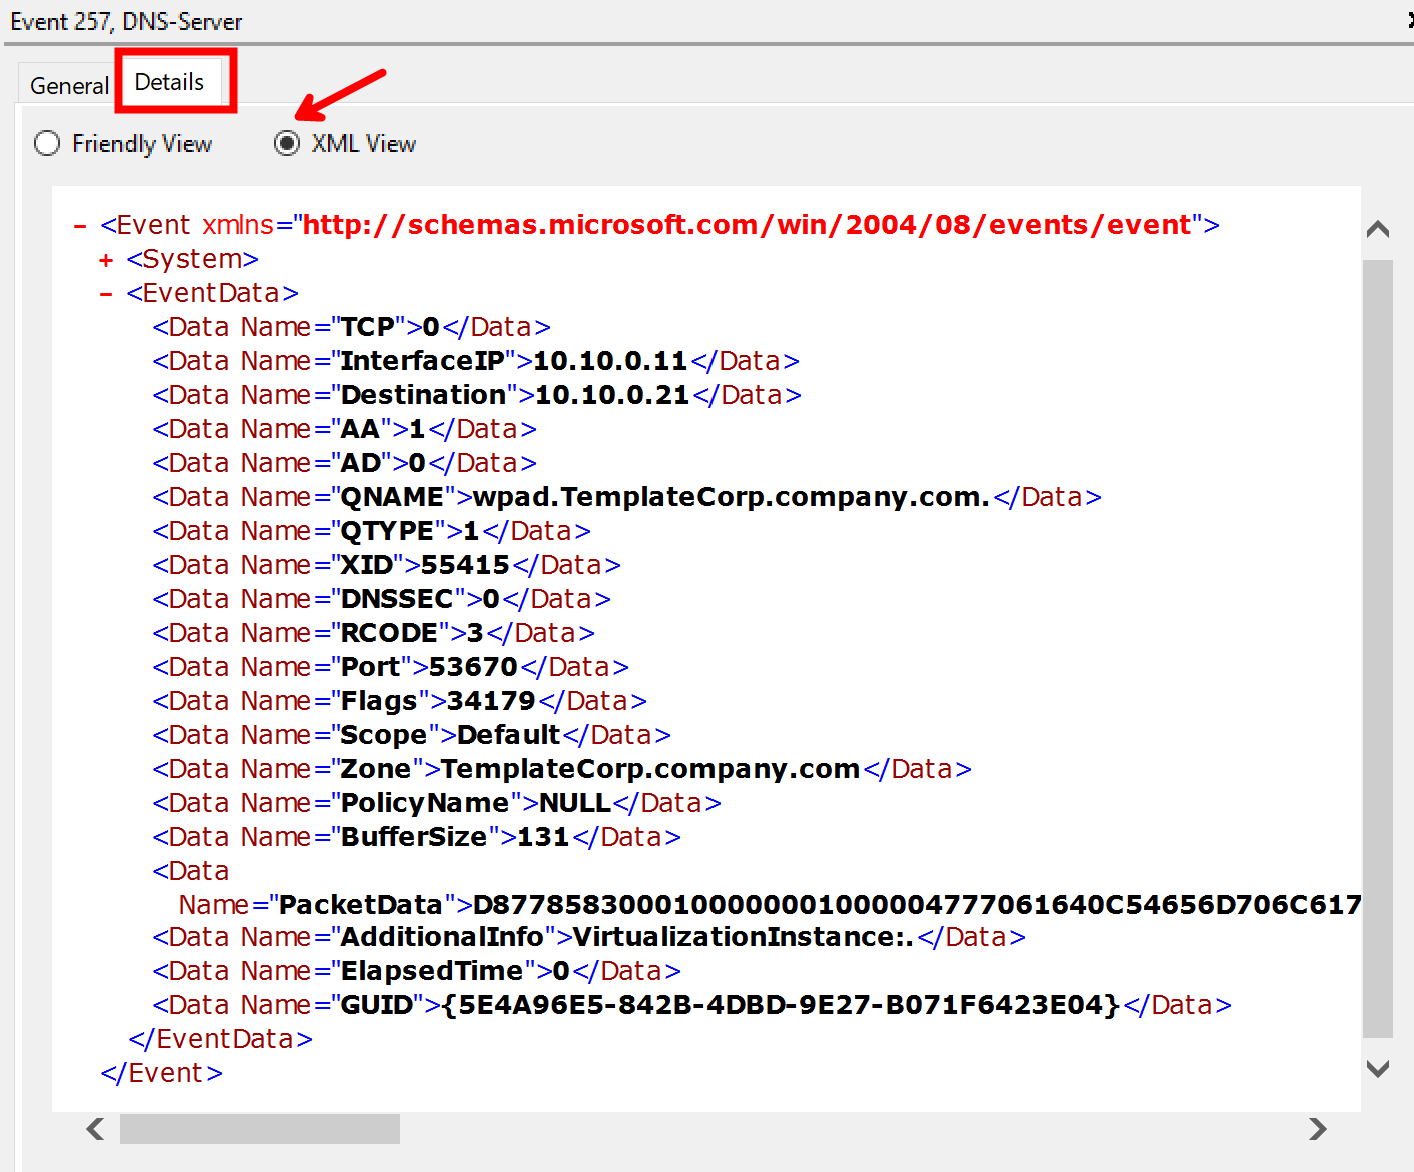
Because of the nature of EventLogs, there is also an XML data view available that provides a more structured view of the captured events. This means the EventLog records do not contain the text message from the screenshot above, but instead contain a raw data structure that is rendered as a text message in Windows Event Viewer.
The events in the “Analytical” log can be exported via Event Viewer, but you may get more flexibility and control when using PowerShell for the query and export of the events. The records can be queried via PowerShell as well:
# Query the records from the Analytical log
$records = Get-WinEvent -LogName "Microsoft-Windows-DNSServer/Analytical" -Oldest

# Show the first 5 records
$records | Select-Object -First 5 | Format-List
Be aware of the required parameter “-Oldest” in the Get-WinEvent command! The cmdlet will return an error on the analytical log if you do not specify this parameter.
Configure the DebugLogFile
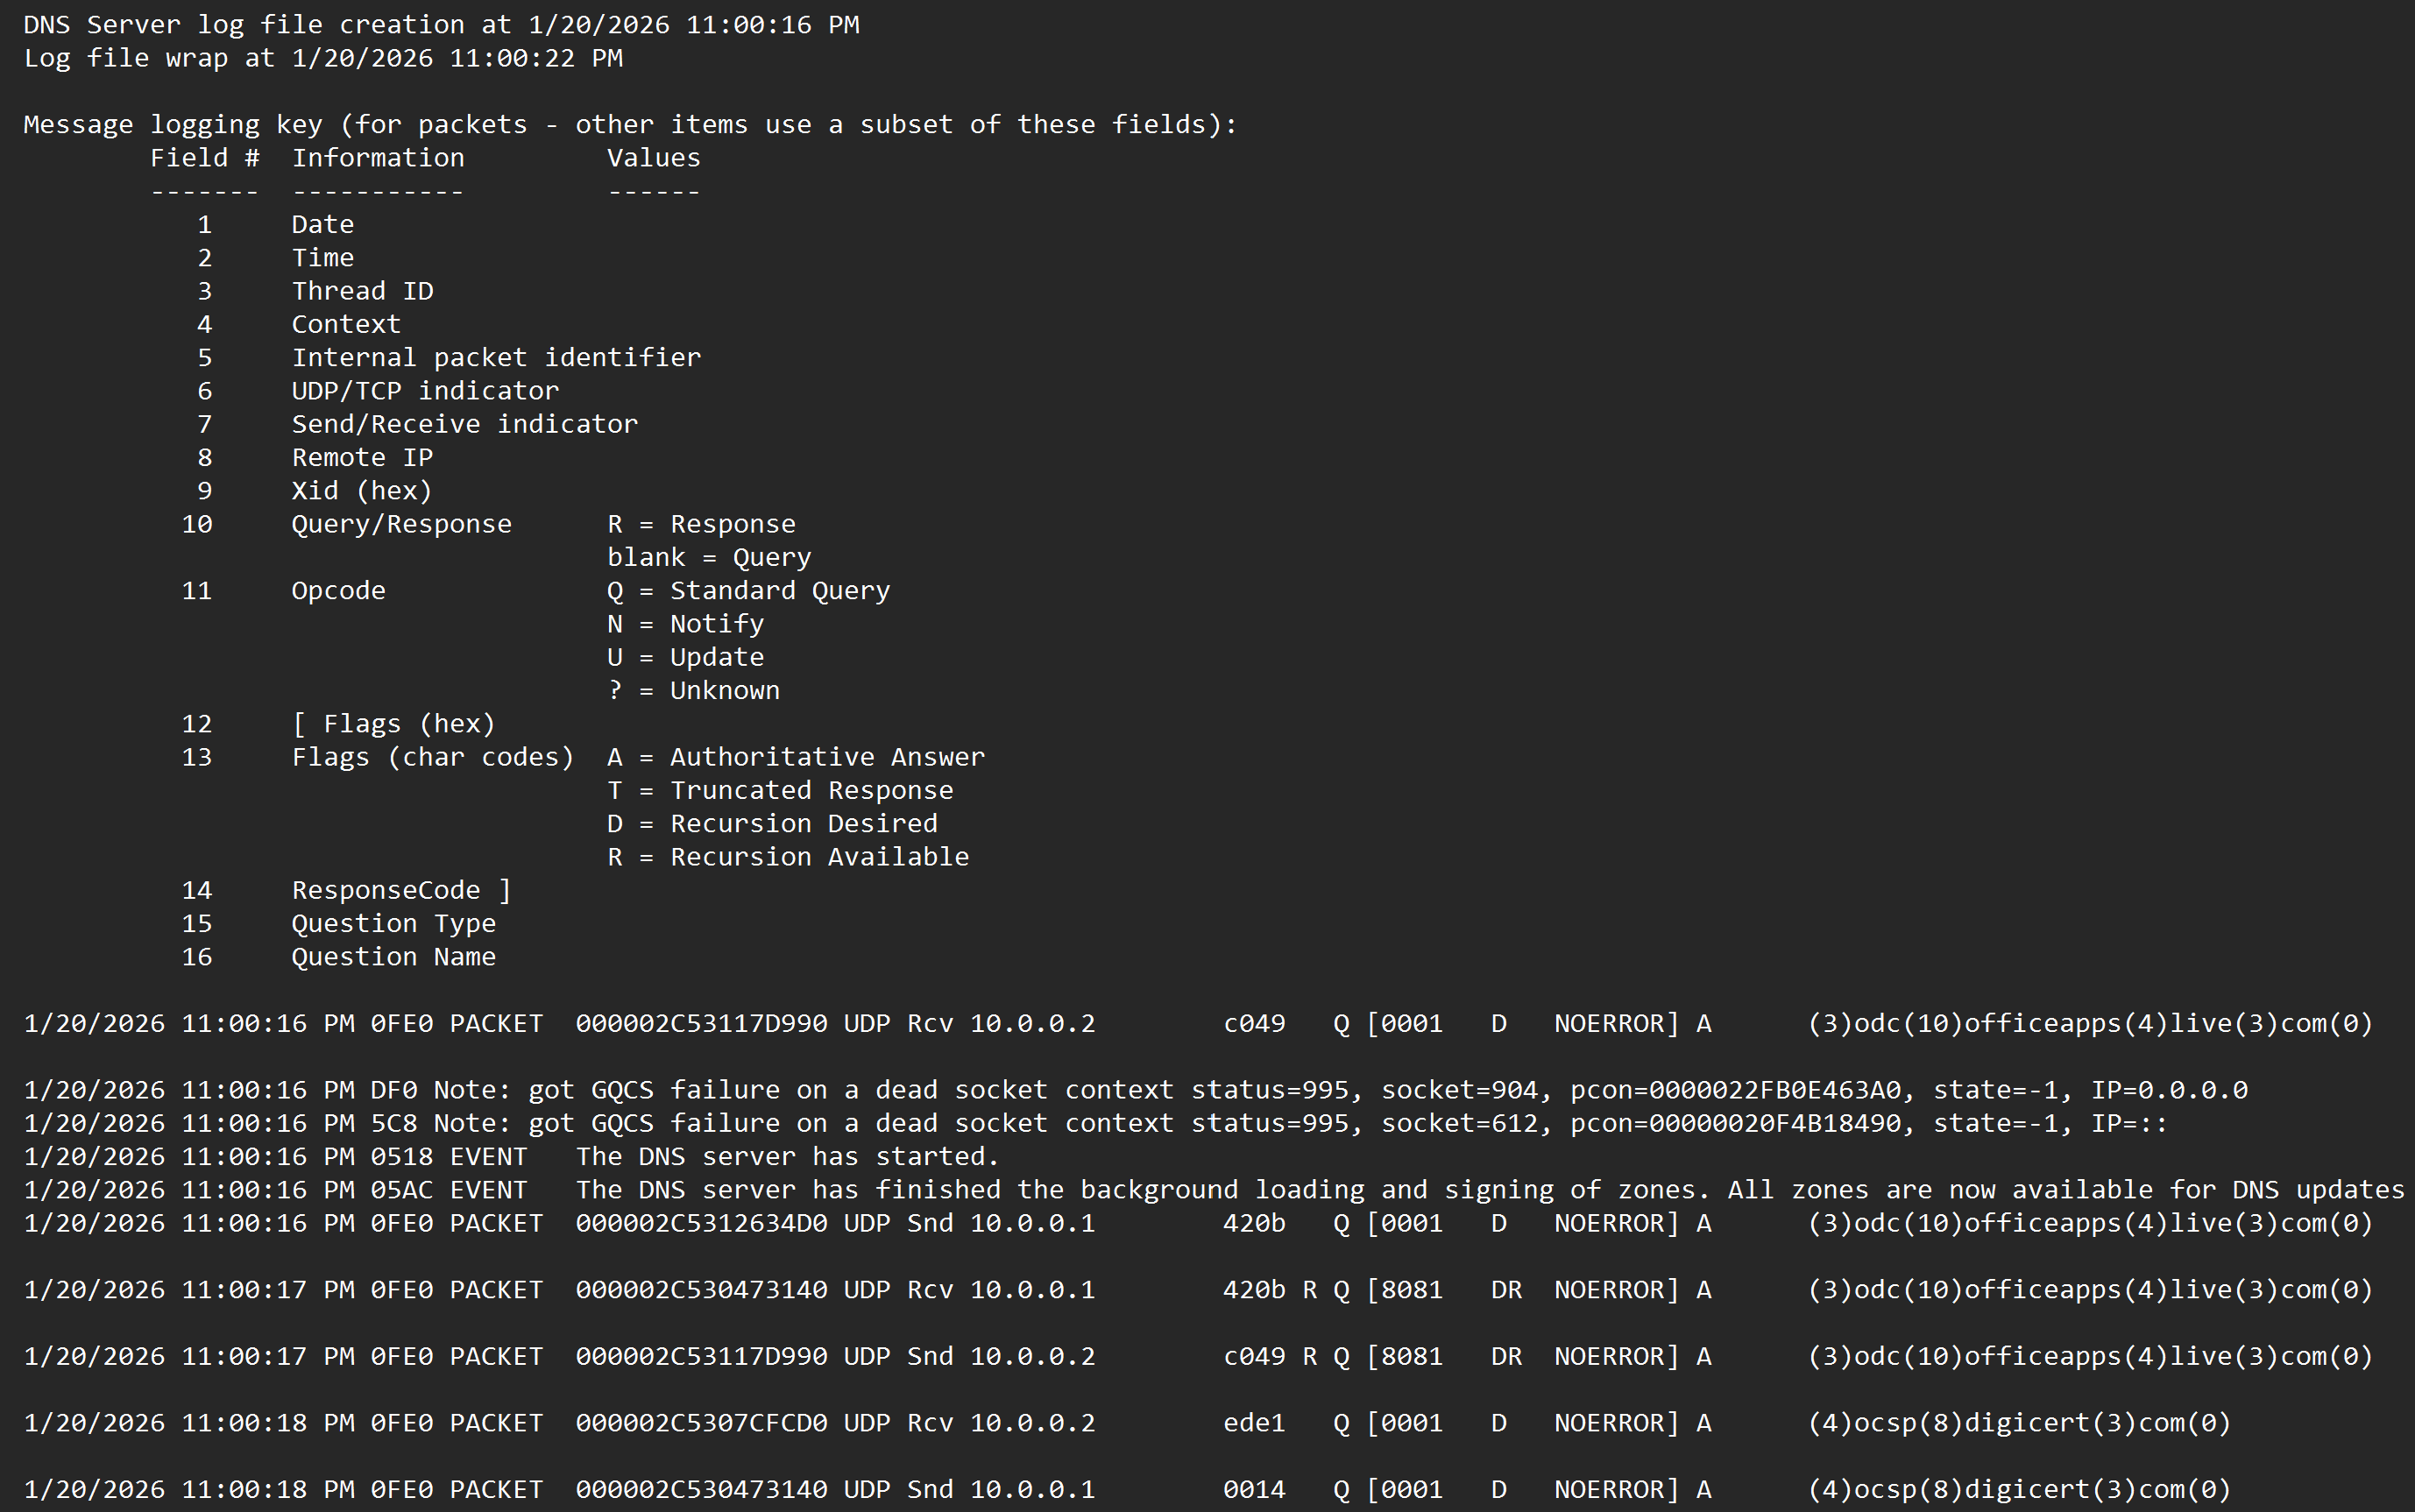
Another, and probably a very valuable, option is to enable the DNS Debug logfile. As outlined above, it is a text-based log file that can be easily enabled and provides detailed information about name resolution operations. Based on the debug log configuration, the provided details can vary from basic “who queried what” up to very, very detailed information with packet details, as well as a lot of DNS-specific opcodes and flags.
There are two ways to enable the debug log file, either via the GUI or via PowerShell.
The GUI is “windows classical” pretty straightforward, you can find the settings in the DNS Manager under the “Debug Logging” section of the server properties.
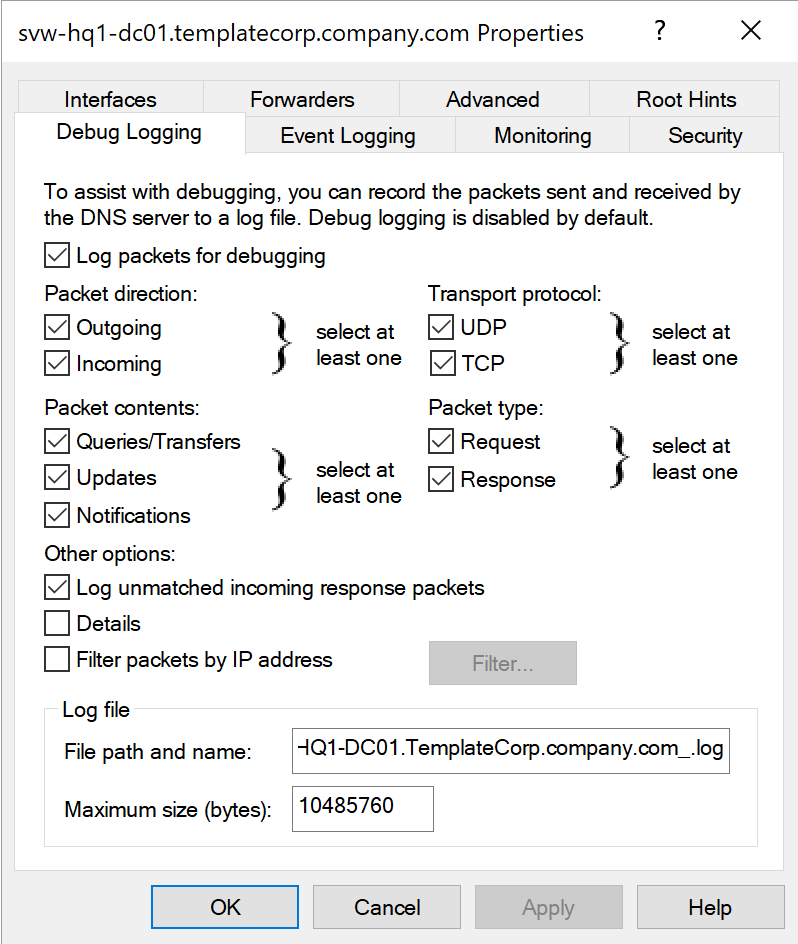
Practical tip: If you have more than one DNS Server (and I suppose you have), it is a very good idea to use the same settings on all servers, to get consistent data across your environment.
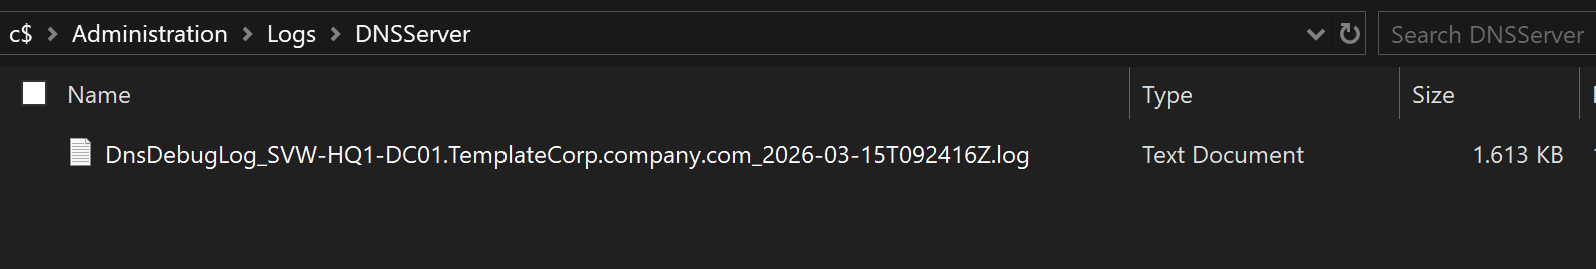
In addition, I recommend putting the name of the server into the log file name, to be able to easily identify the source of the log data.
Even if the GUI seems to be user-friendly and straightforward, it has some downsides and weaknesses. In fact, it does not provide the full range of configuration options, and it is not that scalable if you have more than a small handful of servers. For example, if you want to enable the debug log file on 10 or more servers, you need to be very concentrated to do the same settings and correct writing on all servers over and over again. When it comes to numbers higher than four, I usually prefer a “Dev-Ops” approach over the “Click-Ops” way.
My experience with my own human laziness and flaws in accuracy on repetitive tasks forced me to learn: PowerShell is the way to go
So, unsurprisingly, there are PowerShell cmdlets available to “Get” and “Set” the Debug Log Settings for the DNS Server:
# Get the settings of the DNS Server Debug Log
Get-DnsServerDiagnostic

# Set the settings of the DNS Server Debug Log
Set-DnsServerDiagnostic
The Get command returns all the options from the GUI together with some additional options that are not available in the GUI, like the roll-over settings for the log and the capability to add more DNS server specific internal operational information into the debug log.
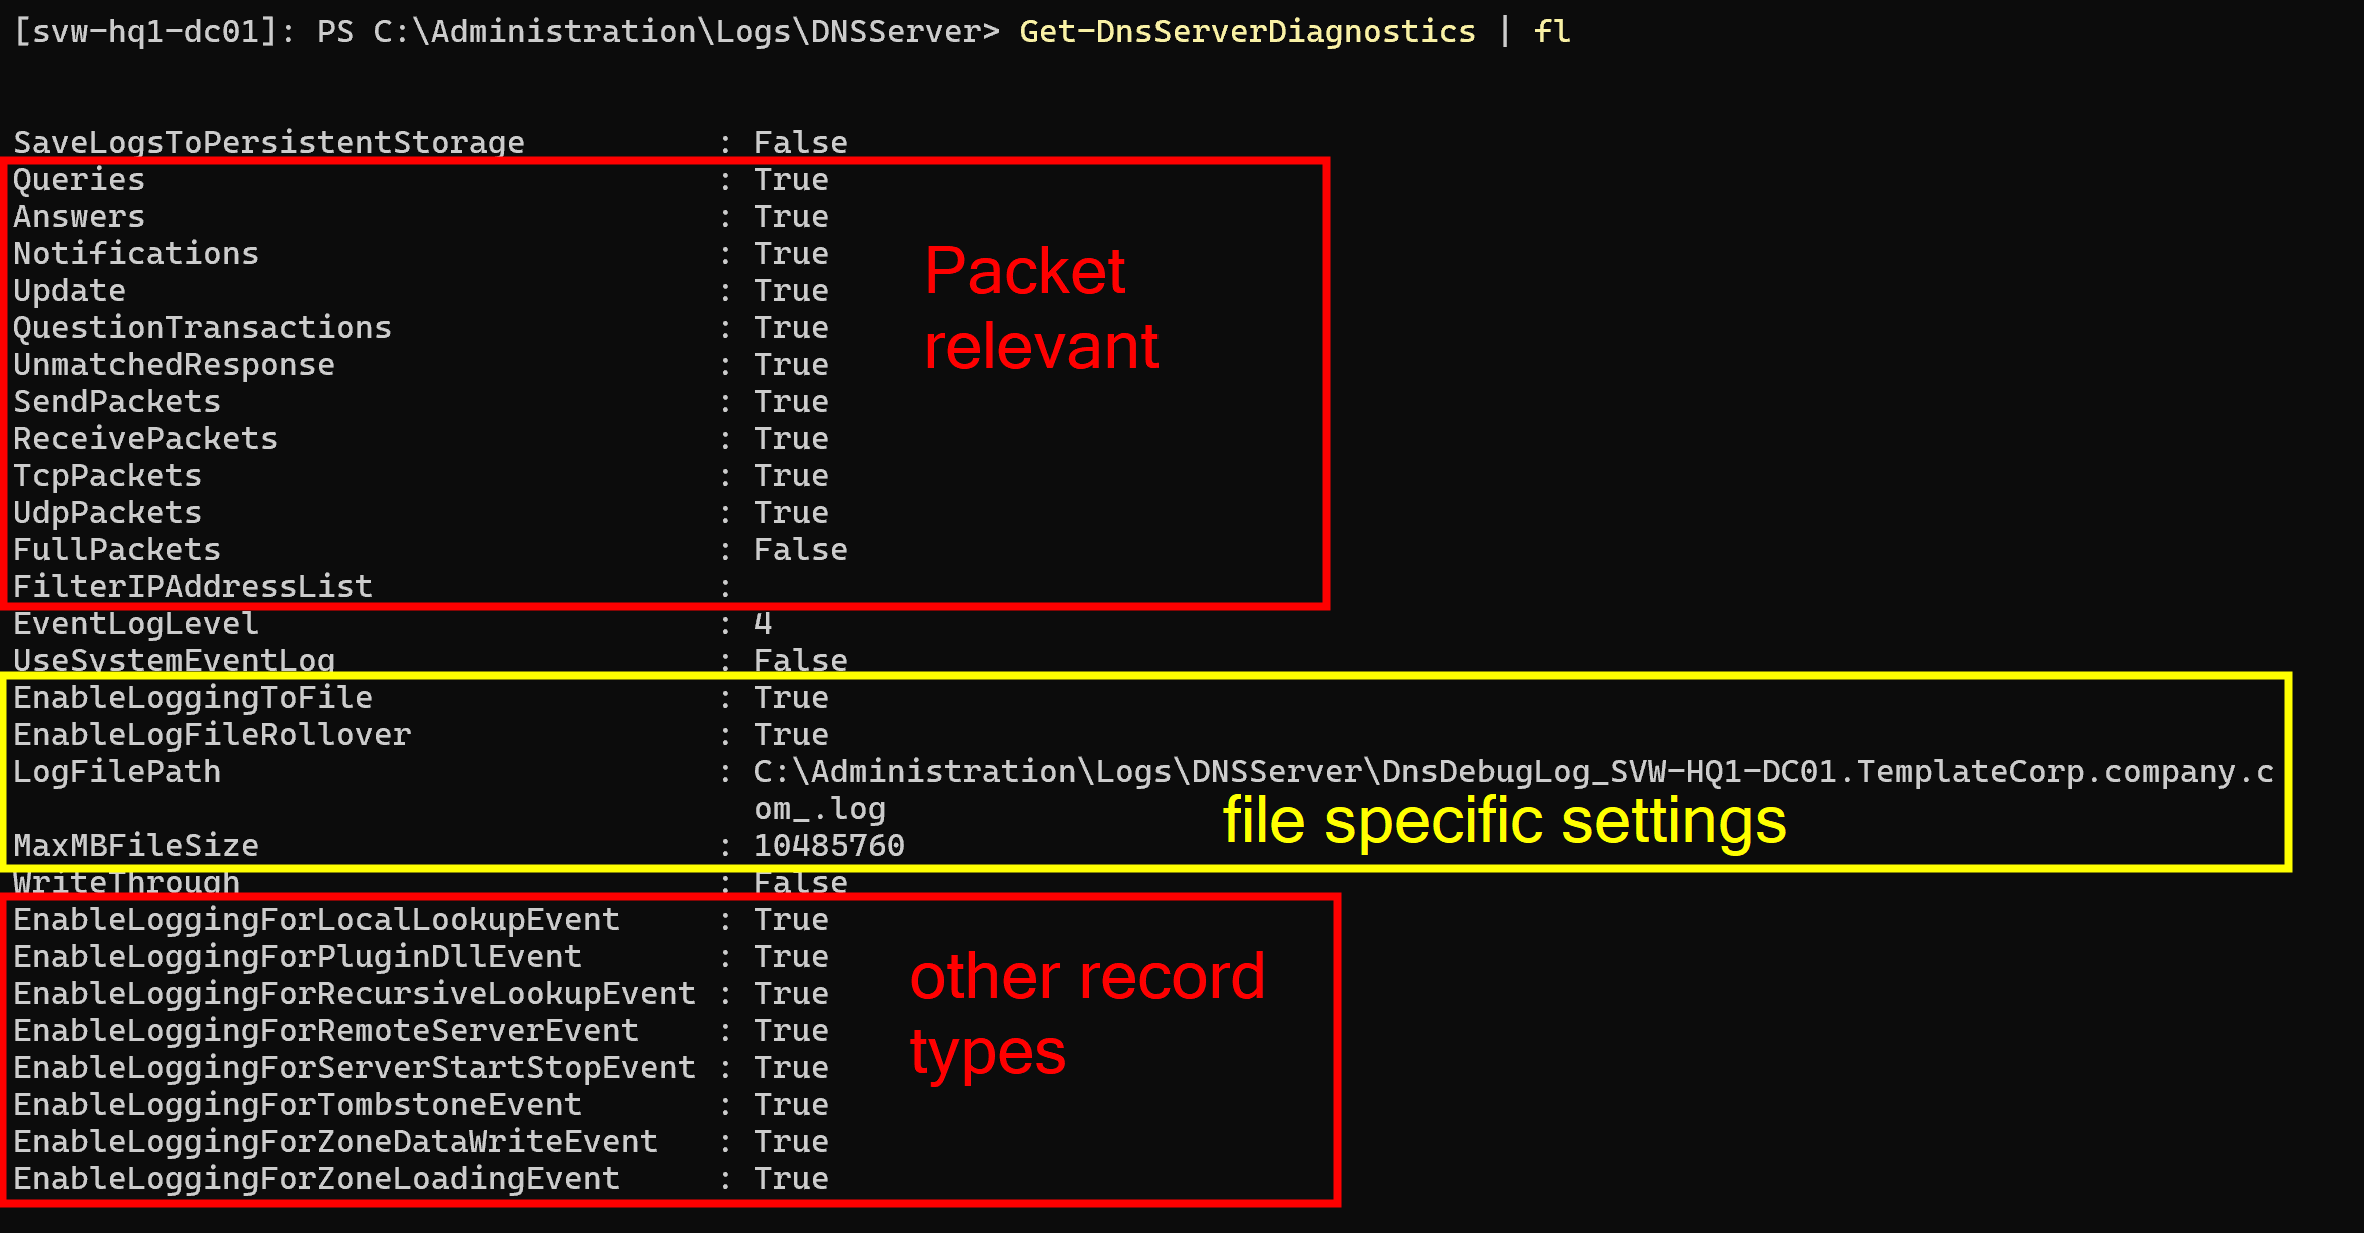
IMPORTANT: Even if the property “MaxMBFileSize” may suggest that the file size is defined in MB, it is actually defined in bytes. So, if you want to set a file size of 10MB, you need to set the value to 10485760 (10 * 1024 * 1024).
Also pay attention to the ending character of the name for “LogFilePath”!
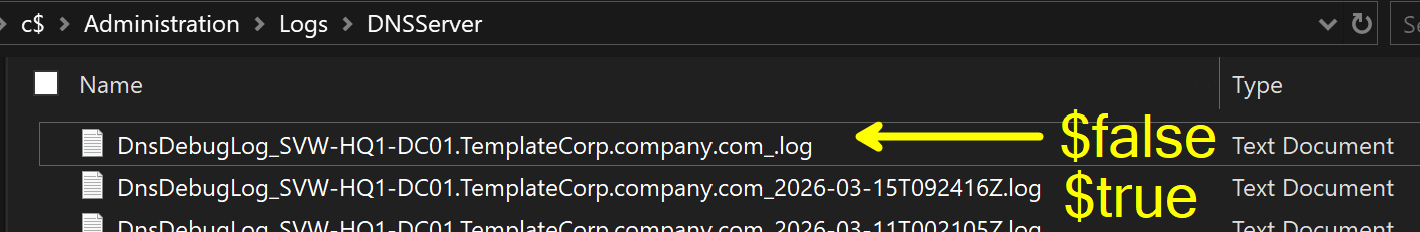
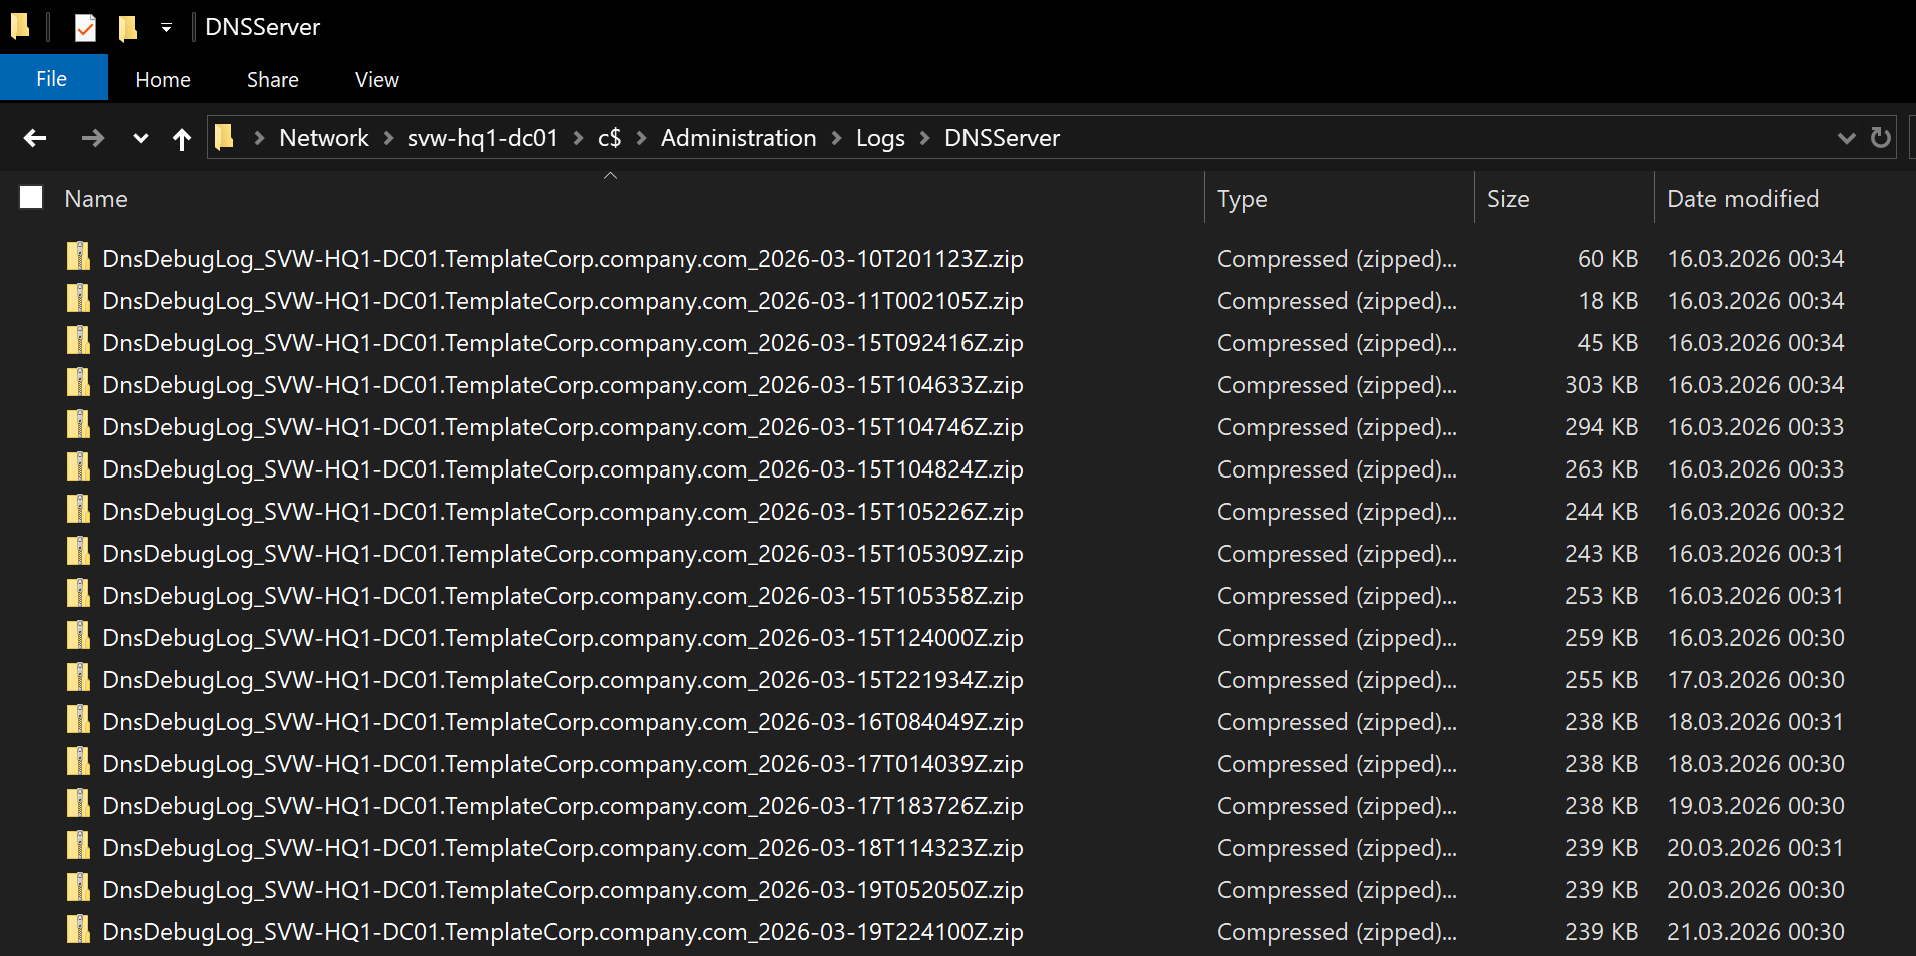
Because I want to have nice filenames and the property “EnableLogFileRollover” enabled, the log filename ends with an underscore. The server adds a timestamp as a suffix to the provided file name when it creates the log. With this approach, I have a clear separation between the servers name and the timestamp.
The following picture shows the different behaviour of the property “EnableLogFileRollover” on the filename:
IMPORTANT: It is also VERY IMPORTANT to understand the behavior of the roll-over process. There is NO overall log size settings! That means, if roll-over is enabled, the server creates a new file every time the specified MaxMBFileSize is reached, but there is no limit on the number of files that can be created.
That means, YOU NEED TO CARE ABOUT THE LOG FILES and the FREE SPACE ON YOUR SERVER!
If you enable the debug log file by “set-and-forget” approach, and you have productive load on your server, you may fill your disk. Depending on the amount of queries and the level of details, this may be up to multiple gigabytes per day if you have a lot of DNS-clients.
AGAIN, DON’T DO SET-AND-FORGET HERE!
You need to have your own strategy to care for the log files. There is no automatic cleanup.
Here is an example of how you can enable the debug log file via PowerShell:
# Specify the desired DNS Server Debug Logging Parameters
$dnsDebugLogParameter = @{
    "Queries"                              = $true
    "Answers"                              = $true
    "Notifications"                        = $true
    "Update"                               = $true
    "QuestionTransactions"                 = $true
    "UnmatchedResponse"                    = $true
    "SendPackets"                          = $true
    "ReceivePackets"                       = $true
    "TcpPackets"                           = $true
    "UdpPackets"                           = $true
    "FullPackets"                          = $false
    "FilterIPAddressList"                  = $null
    "EventLogLevel"                        = 4
    "UseSystemEventLog"                    = $false
    "EnableLoggingToFile"                  = $true
    "EnableLogFileRollover"                = $true
    "LogFilePath"                          = "C:\Administration\Logs\DNSServer\DnsDebugLog_$($env:COMPUTERNAME).$((Get-CimInstance -ClassName "win32_computersystem").Domain)_.log"
    "MaxMBFileSize"                        = (10 * 1mb)
    "SaveLogsToPersistentStorage"          = $false
    "WriteThrough"                         = $false
    "EnableLoggingForLocalLookupEvent"     = $false
    "EnableLoggingForPluginDllEvent"       = $false
    "EnableLoggingForRecursiveLookupEvent" = $false
    "EnableLoggingForRemoteServerEvent"    = $false
    "EnableLoggingForServerStartStopEvent" = $false
    "EnableLoggingForTombstoneEvent"       = $false
    "EnableLoggingForZoneDataWriteEvent"   = $false
    "EnableLoggingForZoneLoadingEvent"     = $false
}

# Apply the defined settings
Set-DnsServerDiagnostics @dnsDebugLogParameter
In the next chapter, we will have a look at my ideas on “how to consume the information from the generated debug logs”. In there, I reference my own PowerShell module DNSServer.DebugLogParser to parse such DebugLogFiles created by the Windows service.
The module is available in the PowerShell Gallery, and in my GitHub account. The GitHub repository also contains additional documentation with a usage guide in a domain environment. In there you can find scripts to probably apply on your servers.
As for the focus of the article, I will not go into more detail on the operational details in a probable production environment. Hopefully, I made a clear statement above that you need to care about additional strategies before enabling such logs.
Consumption of data
OK, by following the above, you have data on your various servers. This means you have junk spread all over the place. In a next step, you need to care about the process of consuming the data and probably bring it into a central place.
For sure, it may be no surprise to you that PowerShell may help you along the way.
EventLogs
Like mentioned before, the “Analytical” Event Log may be something very handy for quick troubleshooting. While we were talking about the what and why in the previous sections, here is an example for a quick troubleshooting session. This can be practical in a situation where you need to deal with issues like “Dude, your DNS server is not returning anything when I ask for ‘xyz’. What the heck!”
Be aware that the following example assumes you are working on an admin workstation and have proper firewall policies in place to remotely manage your servers. If you are working directly on the server, you can simply skip the “-ComputerName” parameter in the commands or use the code in the “-ScriptBlock” parameter directly.
First of all, let’s define some variables, like the server we query:
$Server = "DC01"
You can specify one or more servers directly.
Now, that we have declared what servers to watch, we can enable the analytical log on those servers. When this is done, wait some time or reproduce the issue, then disable the log again.
# Enable the analytical log
Invoke-Command -ComputerName $Server -ScriptBlock {
    wevtutil.exe set-log "Microsoft-Windows-DNSServer/Analytical" /e:true /q
}

# Wait for some time to gather data

# Disable the analytical log
Invoke-Command -ComputerName $Server -ScriptBlock {
    wevtutil.exe set-log "Microsoft-Windows-DNSServer/Analytical" /e:false
}
In the next step, capture the records from the log. Depending on the amount of data, this may take some time, so be patient. After the events are captured, there is some work to do to make the data more usable.
I am using the Message property of the EventLog records to extract the details, because it has the ValueNames already in place. However, there is also the Properties property (🤭 by writing this, this sounds like 🤪 programming stuff) with a table of all the values but without PropertyNames in place. If you like to work with the .Properties property, you need to do some more work to get the values into a usable format, which probably gives you stronger consistency across localization and different Windows versions…
# Get the EventLog records out of the server(s)
$records = Get-WinEvent -ComputerName $Server -LogName "Microsoft-Windows-DNSServer/Analytical" -Oldest | Where-Object Providername -ne ""

# Process the records to enrich the data
$propNames = @("MachineName", "LogName", "TimeCreated", "LevelDisplayName", "RecordId", "Message", "ProviderName", "Id", "Version", "Level", "Task", "Opcode", "Keywords", "ProviderId", "ProcessId", "ThreadId", "ContainerLog", "OpcodeDisplayName", "TaskDisplayName")
$dataRecords = foreach ($record in $records) {
    $hash = [ordered]@{}

    $propNames | ForEach-Object { $hash[$_] = $record.$_}
    $record.Message.split(";").trim() | ForEach-Object { $pair = $_.split("="); $hash[$pair[0].replace(":", "").trim()] = $pair[1].trim() }

    [PSCustomObject]$hash

}
Now, that we have the data in a more usable format, we can do whatever we want with it.
We can display it, export it, or do some live PowerShell analysis on it.
Here are some examples:
# Display the data
$dataRecords | Format-Table

$dataRecords | Out-GridView

$dataRecords | Select-Object -First 1 | Format-List
The raw Format-Table may not be that valuable, because the console will wrap the output. The Out-GridView is a bit more user-friendly, because it provides a scrollable and sortable table. With Format-List, you may get a glimpse of the details of a single record, which gives you the information on what property to hunt for and group by in further analysis.
# Export the data to use it in other tools like Excel, PowerBI, or whatever you like
$dataRecords | Export-Csv -Path "DNSServer-Analytics.csv" -Delimiter ";" -Encoding UTF8 -NoTypeInformation
Exporting to CSV and carrying it over to Excel seems like the typical no-brainer for a lot of cases, because this gives you the power of other tools for slicing and dicing the data.
On the other hand, if you like to do some quick’n’dirty analysis directly in PowerShell while you are on the troubleshooting call, this can be done as well. Here are some ideas:
# Slice and dice... get information out of the data directly in PowerShell with basic grouping
$dataRecords | Group-Object TaskDisplayName
$dataRecords | Group-Object QNAME
$dataRecords | Group-Object InterfaceIP
$dataRecords | Group-Object Source

# Some more advanced grouping examples
$dataRecords | Group-Object { "Source '$($_.Source)' on Interface '$($_.InterfaceIP)'" } | Format-Table Count, Name
$dataRecords | Group-Object { "Source '$($_.Source)' on Interface '$($_.InterfaceIP)' with '$($_.QNAME)'" } | Sort-Object Name | Format-Table Count, Name
$dataRecords | Group-Object { "'$($_.QNAME)' - Source '$($_.Source)' ($($_.TaskDisplayName))" } | Sort-Object Name | Format-Table Count, Name
$dataRecords | Group-Object { "'$($_.QNAME)' - Source '$($_.Source)' on Interface '$($_.InterfaceIP)' ($($_.TaskDisplayName))" } | Sort-Object Name | Format-Table Count, Name

# Grouping combined with filtering
$dataRecords | Where-Object TaskDisplayName -like "LOOK_UP" | Group-Object { "Source '$($_.Source)' - '$($_.QNAME)'" } | Sort-Object Name | Format-Table Count, Name

# After we explored the possible values from the basic grouping, we can filter and list the records with their details
$dataRecords | Where-Object TaskDisplayName -like "LOOK_UP" | Where-Object Source | Sort-Object TimeCreated | Format-Table MachineName, TimeCreated, Source, InterfaceIP, QNAME, QTYPE
$dataRecords | Where-Object TaskDisplayName -like "LOOK_UP" | Where-Object Source -like "10.1.1.1" | Sort-Object QNAME | Format-Table MachineName, TimeCreated, Source, InterfaceIP, QNAME, QTYPE
By showing this, I hope to give you some ideas on how to get insights out of the data, and how to use PowerShell for that.
Of course, there are many more options available and this may not scale for very large datasets or over long periods of time. Therefore, let’s have a look on the next chapter…
DebugLogFile
Putting an eye on the DNS Debug Log file option brings a solution to deal with the unattended and longer-term approach. It may also scale better on large datasets within bigger environments. The file itself is text-based, so it can be read by opening it in Notepad.
Unfortunately, the format is not perfectly structured, so there is a need for some data processing to get the data into a more usable format. So, like we did with the EventLogs before, let’s go into PowerShell to do some parsing magic.

While doing some research and AI work on the format of the DebugLogFile, funnily, the AI complained about, that the format is not perfectly structured for easy parsing. 🤪
To face this challenge, I have created a PowerShell module called DNSServer.DebugLogParser.
The module provides comprehensive parsing logic within a single cmdlet. It’s basically a “one-stop-shop” for converting the “not so parseable logfile” into a valid and easy-to-use CSV file. The module takes care of all the necessary steps.
Within the assets folder in the GitHub repository of the module, you can find some example log files and their converted CSVs to check out. Obviously, you can and should use your own files from your environment as well!
So, to give you a quick example on the conversion process, here is a simple example on how to use the module to convert a DebugLogFile into a CSV file:
# Import the module (make sure to install it before)
Import-Module DNSServer.DebugLogParser

# Parse the DebugLogFile and export to CSV
Convert-DNSDebugLogFile "DnsDebugLog_DC01.log"
By doing this with all the default settings of the command, you get 3 CSV files as output from the conversion process.
| File | Description |
|---|---|
| DnsDebugLog_DC01.csv | This is the converted logfile with its details in a CSV-styled format |
| DnsDebugLog_DC01_Statistic.csv | A CSV with a statistic with a summarization for all types of records in the log per day |
| DnsDebugLog_DC01_PacketStatistic.csv | A CSV with a statistic for the type “Packet” and a summarization on all clients per day |
Like already outlined in the previous sections, the CSVs can be used for further analysis in Excel, PowerBI, or whatever you like. The intent of producing multiple files is to face the challenges of big data in larger environments.
Depending on your use case, you probably only want to have usage statistics. With this approach, you do not need to inspect all the details in the full log. It may cut down the storage amount tremendously, because it already summarizes the data and ignores all the noisy details.
In case you want to go deep for hunting and analysis details, you may want to use the full log and ignore the statistics, because they do not provide enough details.
But wouldn’t it be nice to have a parameter to specify which of the output files you want to have?
Say hello to the -OutputType parameter!
Convert-DNSDebugLogFile -InputFile "DnsDebugLog_DC01.log" -OutputType Statistic
With this, you can specify if you want to have only the log, only the statistics, or both. This gives you more flexibility and potentially saves you a lot of storage space.
By inspecting the generated CSV files, you may realize there is an empty column called “ComputerName” in the CSVs.
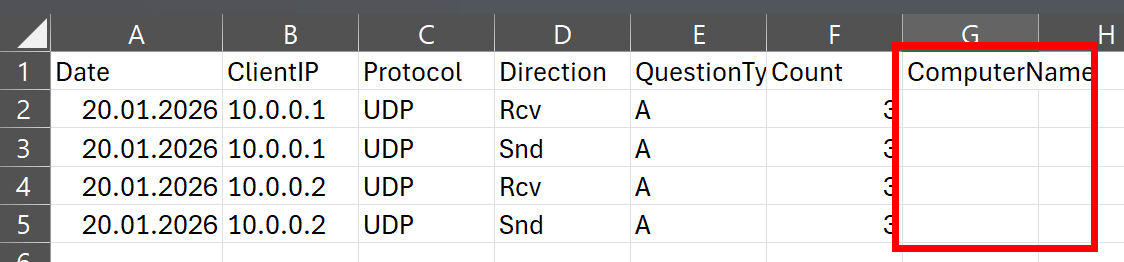
This is because the DNS Debug log does not contain the name of the server. 🤷♂️
You can bring life into this column by passing the name of the server to the -ComputerName parameter in the command.
# Manually specify the computer name
Convert-DNSDebugLogFile -InputFile "DnsDebugLog_DC01.log" -ComputerName "DC01"
Do you remember my advice in the section Configure the DebugLogFile on putting the name of the server in the logfiles name? With practice, you can put the server’s name into the CSV file on the fly by splitting the file name.
# Automatically extract the computer name from the file name
$files = Get-ChildItem c:\logs\*.log

foreach($file in $files) {
    Convert-DNSDebugLogFile -InputFile $file.FullName -ComputerName $file.BaseName.split("_")[1]
}
This is especially helpful if you have multiple servers and want to have the server name in the CSV for better identification and analysis.
Another thing you probably want to take care of is the date format in the generated CSV. By default, the format from the underlying log file is used.
That can result in challenges when you have an international environment with localized servers out there. Probably, the date format may vary from server to server. That will create challenges when you want to do some analysis on the date in tools like Excel or PowerBI, because they may not recognize the date format correctly. To face this, you can make use of another parameter on the command… welcome the -OutputCulture parameter.
My personal preference on date format is the ISO format, so I usually set the swedish output culture ("sv-SE"), because it uses the ISO format for date and time. With this, I can ensure that the date format in the generated CSV is consistent, sortable and easily recognizable, regardless of the locale settings.
Convert-DNSDebugLogFile -InputFile "DnsDebugLog_DC01.log" -OutputCulture "sv-SE"
As a side note, there is also an -InputCulture parameter if you are aware of the explicitly used format on the source server. This parameter behaves the same way as the -OutputCulture parameter, but it is used to specify the culture for parsing the date from the source log file.
Last but not least, two practical tips for production use:
After the conversion of the original written log file into the CSV, you may want to delete it to save storage space. The CSV should contain all the information in a more usable format. With the -RemoveSourceFile parameter, you can do this without additional effort.
And because the logfiles are plain text and may be quite big, you may want to have them zipped after the conversion. With the -CompressOutput parameter, you can do this as well on the fly.
Convert-DNSDebugLogFile -InputFile "DnsDebugLog_DC01.log" -OutputCulture "sv-SE" -RemoveSourceFile -CompressOutput
Combining all of the above, you can have a pretty powerful and flexible tool to get data for further analysis from the DNS debug logs, while also taking care of storage space and file management. As a final example, I want to bring up a more complete example that you can use in a production environment:
# get the fully written (rolled over) log files from the log folder
$files = Get-ChildItem "C:\Administration\Logs\DNSServer\*.log" | Sort-Object lastwritetime, Name -Descending | Select-Object -Skip 1

# Passing the files into conversion with all the practical parameters for a production use
foreach($file in $files) {
    $file | Convert-DNSDebugLogFile -ComputerName $file.BaseName.split("_")[1] -Delimiter ';' -OutputType 'Both' -ContextFilter Packet -OutputCulture sv-SE -CompressOutput -RemoveSourceFile
}
This example, especially with the filtering in the file selection process, is intended to run directly on the DNS servers. But it is also fine to run it on a dedicated machine to spare resources on the DNS servers. If it is running on a dedicated machine, you do not need to use Select-Object -Skip 1 in the file selection process.
In any case, you need to take care of collecting the files, regardless of whether they are the finally processed files or the original log files. With the shown example, the advantage is that you will only transport already compressed ZIP files. That may be a good approach to save network bandwidth, especially if you have widely distributed servers with a lot of log data.
Create Reporting
After the configuration and collection of the data, you probably want to make use of it to create valuable insights and reports. Depending on your use case, there are different tools available to do this. Let’s have a look at some of the options.
I am fully aware that there are many more tools and approaches available, so treat the following sections just as basic examples to get a glimpse of the possibilities.
PowerShell - the quick shot
As already outlined in the section Consumption of data - EventLogs, you can do some quick analysis directly in PowerShell by importing the data. This may be handy in quick troubleshooting sessions, where you only want to quickly catch some basic information. For sure, this is not the first-class solution for complex analysis or long-term reporting, but it is possible.
I will not go that much into details here, because we already covered the basic grouping and filtering options in the section Consumption of data - EventLogs. Just as another example, the same approach with Group-Object can be applied on the CSV files from the DebugLogFile as well:
# Import the data from the generated CSV file
$dataRecords = Get-ChildItem C:\Administration\Logs\DNSServer\*_PacketStatistic.csv -File -Recurse | Import-Csv -Delimiter ";" -Encoding utf8

# Summarize how many DNS queries were made
$dataRecords | Measure-Object Count -Sum

# What servers are in the data
$dataRecords | Group-Object ComputerName -NoElement

# What kind of DNS queries were collected
$dataRecords | Group-Object QuestionType -NoElement

# What DNS clients IPs are in contact with the server(s)
$dataRecords | Group-Object ClientIP -NoElement

# What DNS clients are talking to which server distinctly
$dataRecords | Group-Object { "$($_.ClientIP) --> $($_.ComputerName)" } | Format-Table Name -AutoSize
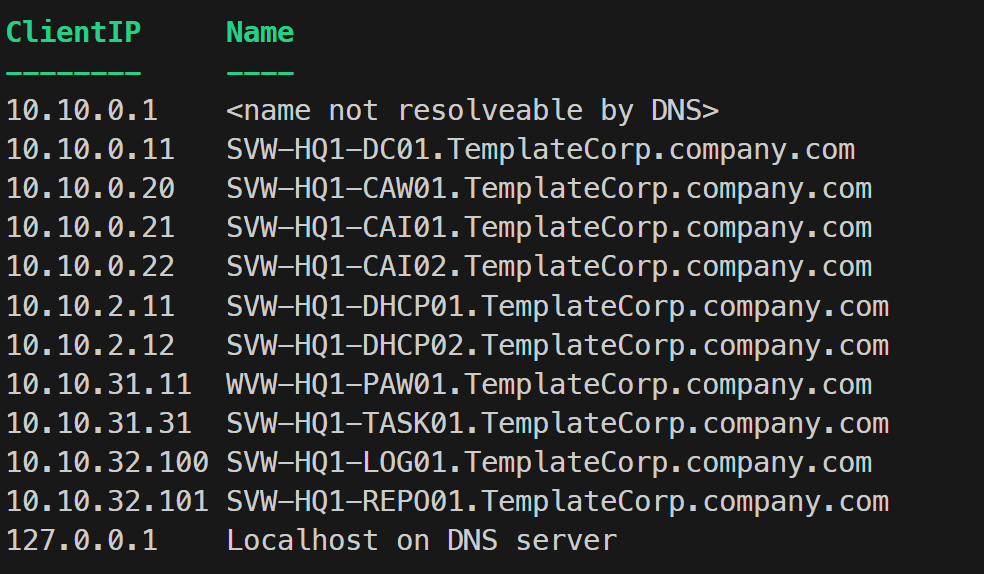
Especially the last example on grouping for ClientIP can be very handy to build a correlation table for the IP and the respective name of the system. This requires proper DNS infrastructure with all devices registered in place, of course. Here is how you can do this with PowerShell:
# Get the list of unique client IPs from the data records
$clientIPList = $dataRecords | Group-Object ClientIP -NoElement | Select-Object -ExpandProperty Name

# Resolve the client IPs to hostnames and create a mapping table
$clientMapping = foreach ($clientIP in $clientIPList) {
    if ($clientIP -in ("127.0.0.1", "0.0.0.0", "::1", ".")) {
        [pscustomobject]@{
            ClientIP = $clientIP
            Name     = "Localhost on DNS server"
        }
    } else {
        $result = Resolve-DnsName -Name $clientIP -Type PTR -QuickTimeout -ErrorAction SilentlyContinue

        if (([array]$result).count -ge 1) {
            [pscustomobject]@{
                ClientIP = $clientIP
                Name     = (($result.NameHost | Sort-Object) -join "; ")
            }
        } else {
            [pscustomobject]@{
                ClientIP = $clientIP
                Name     = "<name not resolvable by DNS>"
            }
        }
    }
}

# Output the client mapping table
$clientMapping | Format-Table -AutoSize

# Export the client mapping to a CSV file for further use
$clientMapping | Export-Csv -Path "ClientIP_Mapping.csv" -Delimiter ";" -Encoding UTF8 -NoTypeInformation
Such a client mapping may be handy and helpful. Results may look like this:
Excel - the classical and flexible option
Using Excel is probably the most common approach for quick and flexible CSV based analysis. And there is nothing wrong with that, because Excel provides a lot of options for filtering, grouping, and visualizing data to get valuable information. It is also pretty user-friendly and most people are somewhat familiar with it. The only downside is, it may not scale that well with very large datasets.
For a quick analysis on “Who is using my DNS servers for what kind of queries?”, Excel is totally fine. Simply put the generated PacketStatistic CSV files into a folder and tell Excel to import the folder via the data tab.
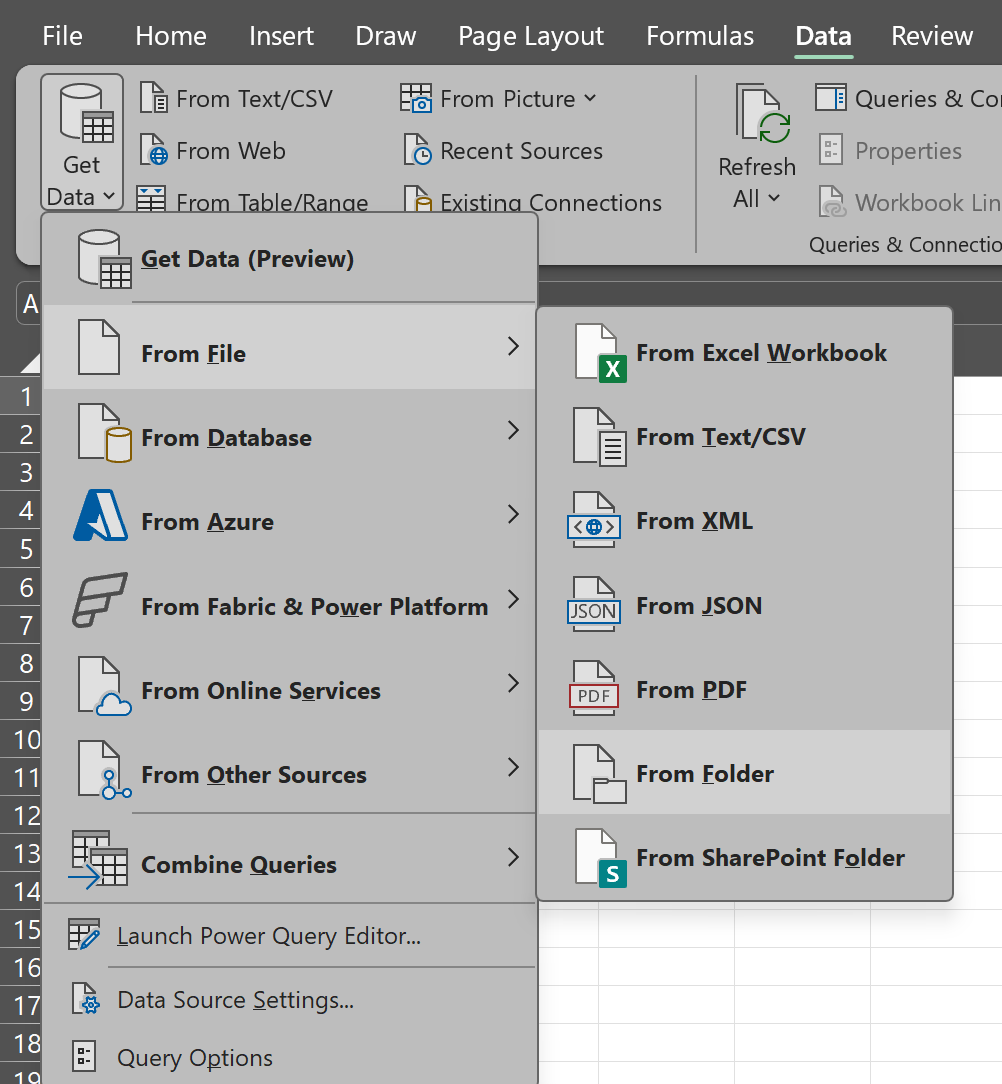
By selecting the folder, Excel will automatically import all the CSV files in there and combine them into a single table. Due to the packetstatistic files are not that big, this should work pretty well even in mid-size environments with a couple of servers.
After the data is imported, you can use Excel’s features to analyze and visualize the data as you like. With some more investment into the data import logic within PowerQuery, or the use of additional formula columns afterwards, you may correlate the Client IPs from the CSVs with the ClientIP_Mapping.csv file from the example above to get the names of the clients into the same table.
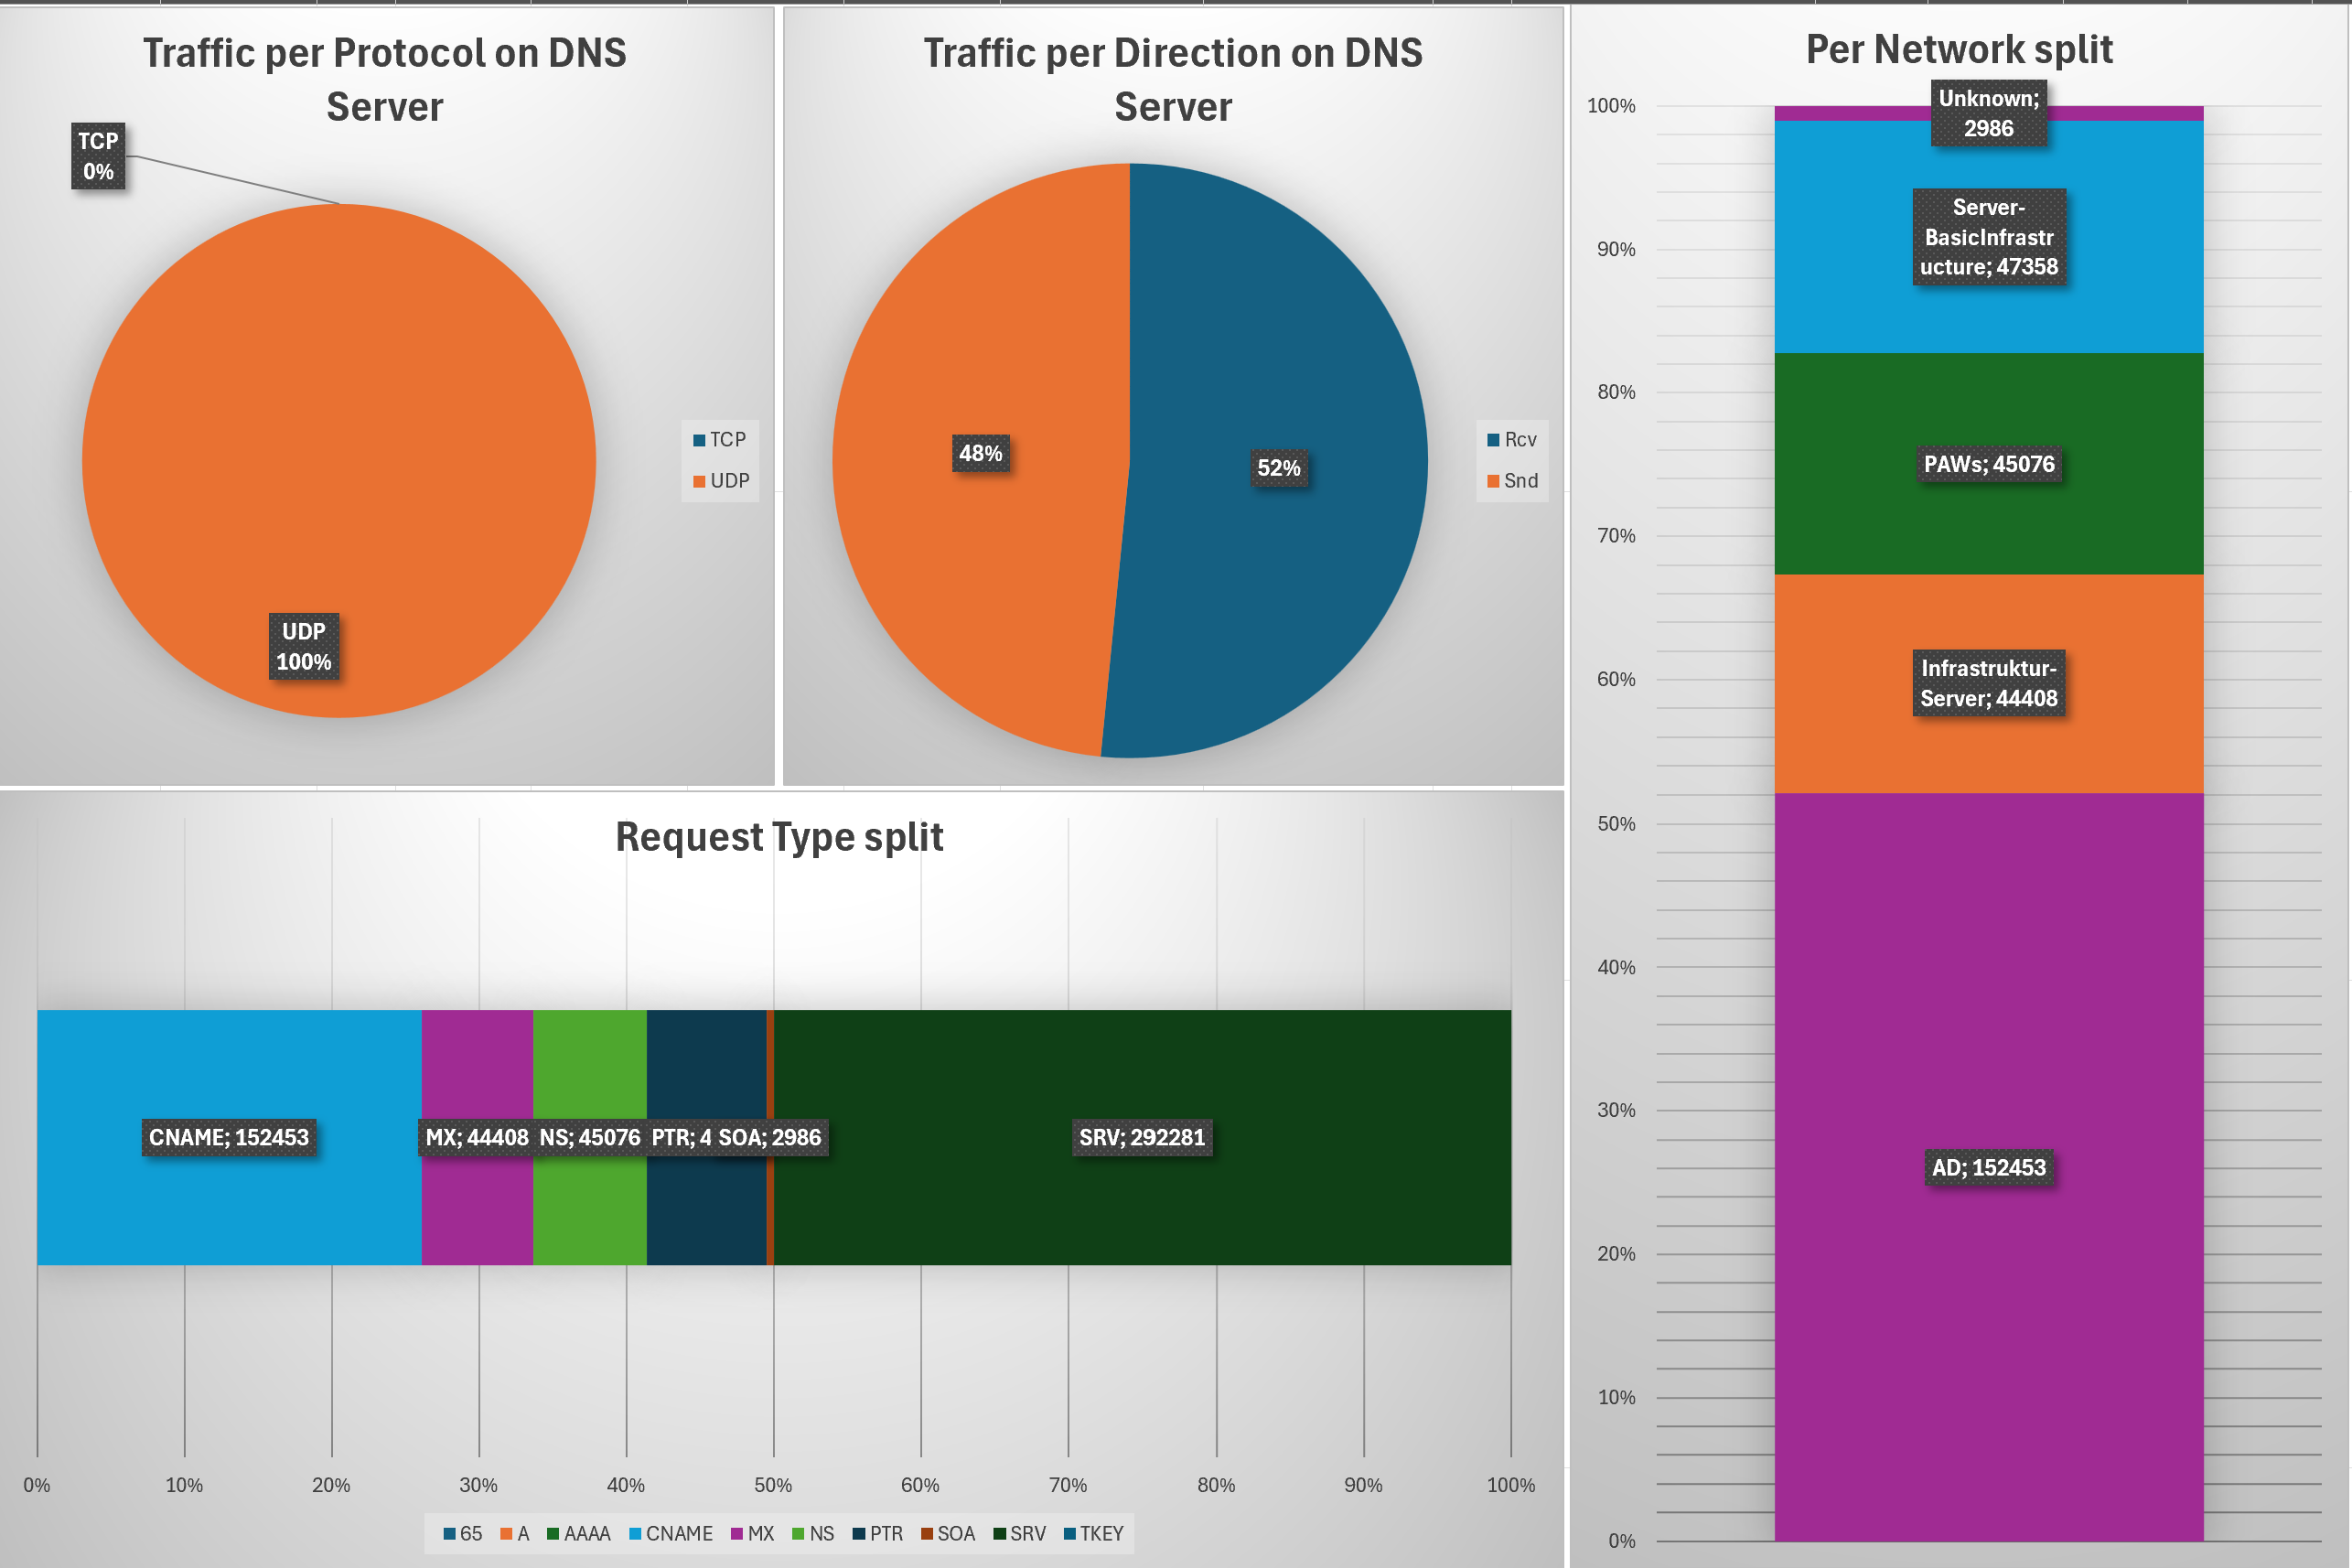
By utilizing the “PivotTable” feature combined with the Pivot Diagrams, visualizing the data is pretty easy and provides a lot of options to slice and dice.
This can be an overview like shown above or time-driven charts.
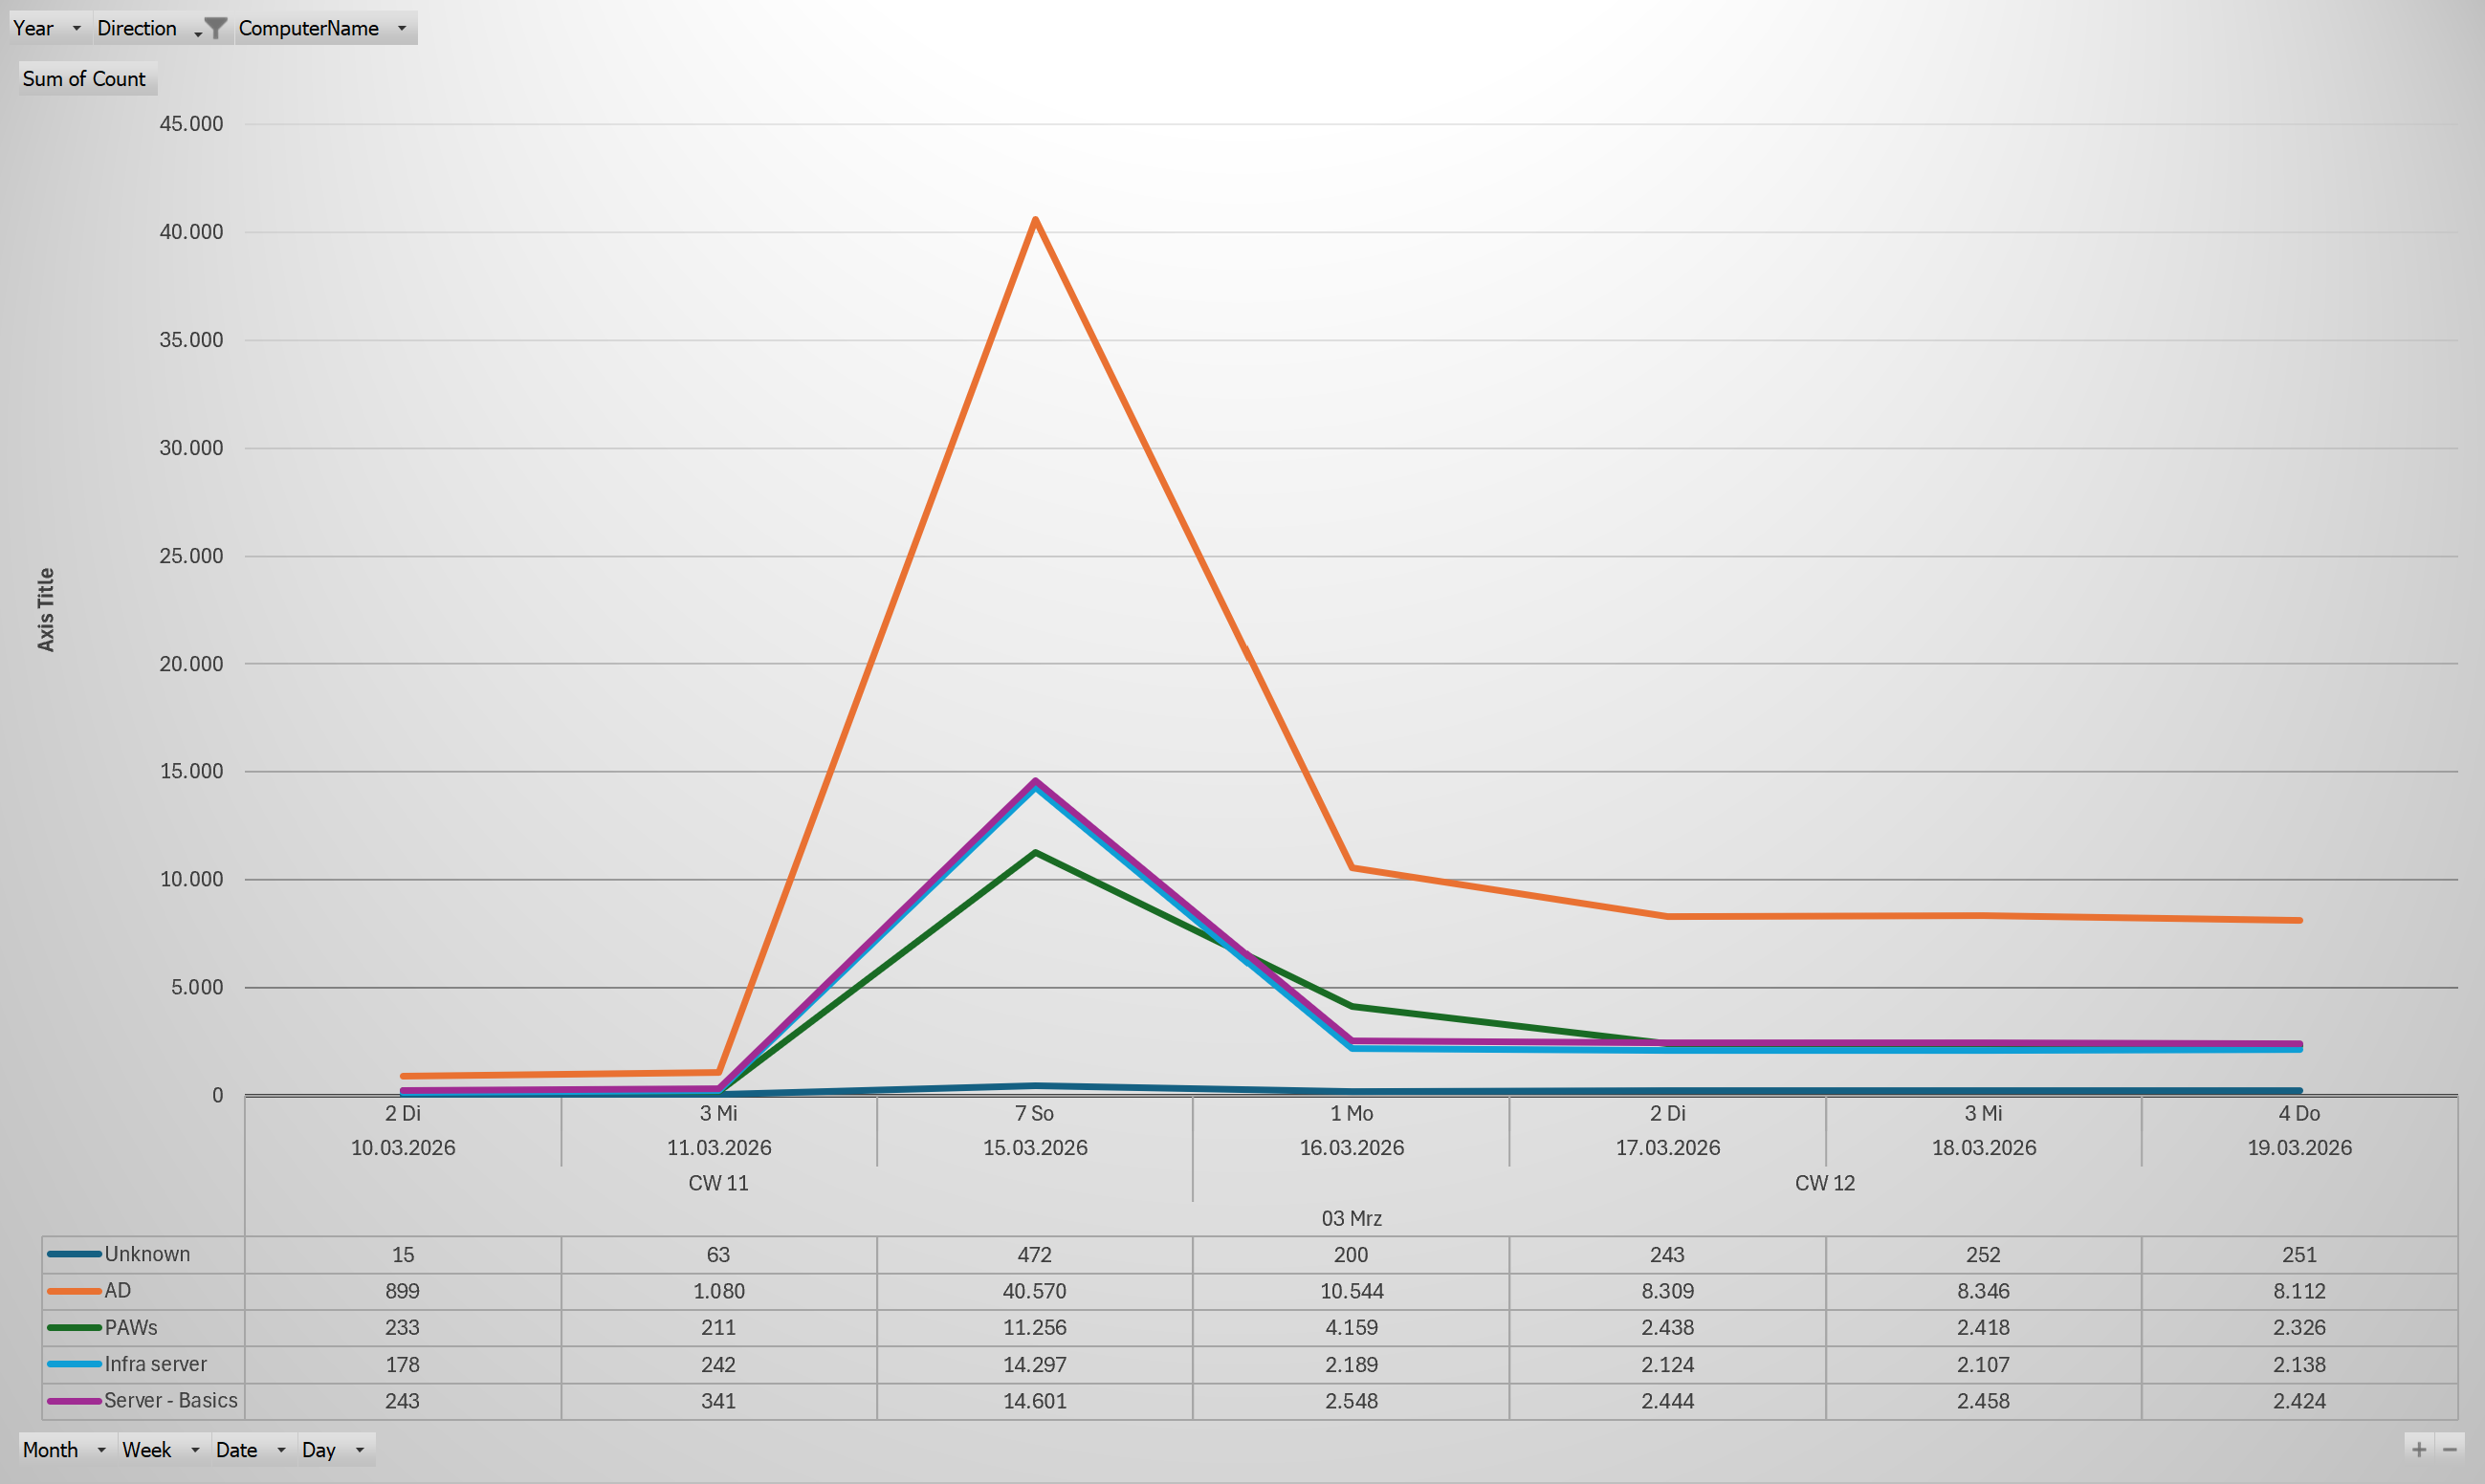
Not to forget multi-dimensional data tables like this one, that shows the distribution of query types over the different DNS clients.
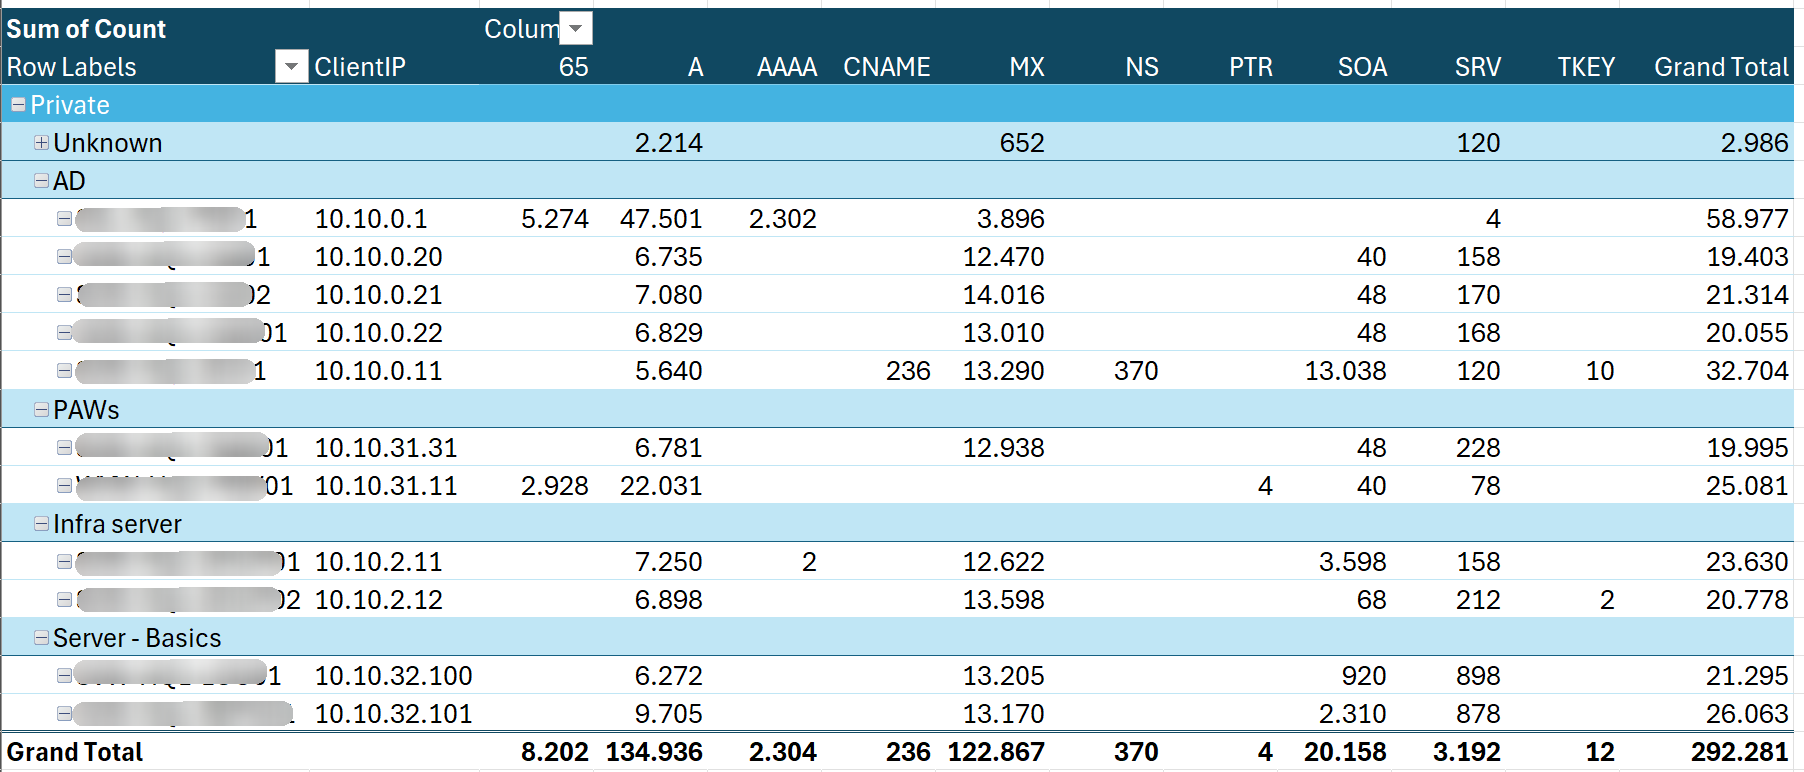
All that should just be an example… and I want to clearly outline that this may not fit your needs or your company’s or customer’s design. Treat it as inspiration to create your own. If you want to take a look at the formulas and Pivot logic I have used to build the shown examples, here is the Excel file with the data and the examples.
PowerBI - the modern, powerful choice
When it comes to “big data” in “large corporate environments”, PowerBI is a strong contender. Excel may reach its limits, because it is not designed to handle very large datasets. When you have a couple of hundreds of servers the number of files and even the records in the files quickly may come to numbers that reach thousands, millions or even billions.
This is where PowerBI makes its statement, because it is designed to handle large datasets, provide powerful analysis and visualization, with the capability to automatically refresh on a regular basis and be consumed by multiple users without the need to know how to deal with the underlying data.
The import logic in PowerBI is the same as in the Excel data import, PowerQuery. With that given, this means it is more or less the same import logic in PowerBI and Excel. The difference begins in the way PowerBI handles the data after the import, and how it provides options for visualization and sharing.
Pretty sure, the PowerBI and Fabric experts out there, may want to punish me for comparing PowerBI to Excel, but for basic understanding, let’s stay with that. I will not go much more into detail on the PowerBI specific features, because it will go beyond the scope of this article, but I want to give you at least some ideas on how it probably can look like.
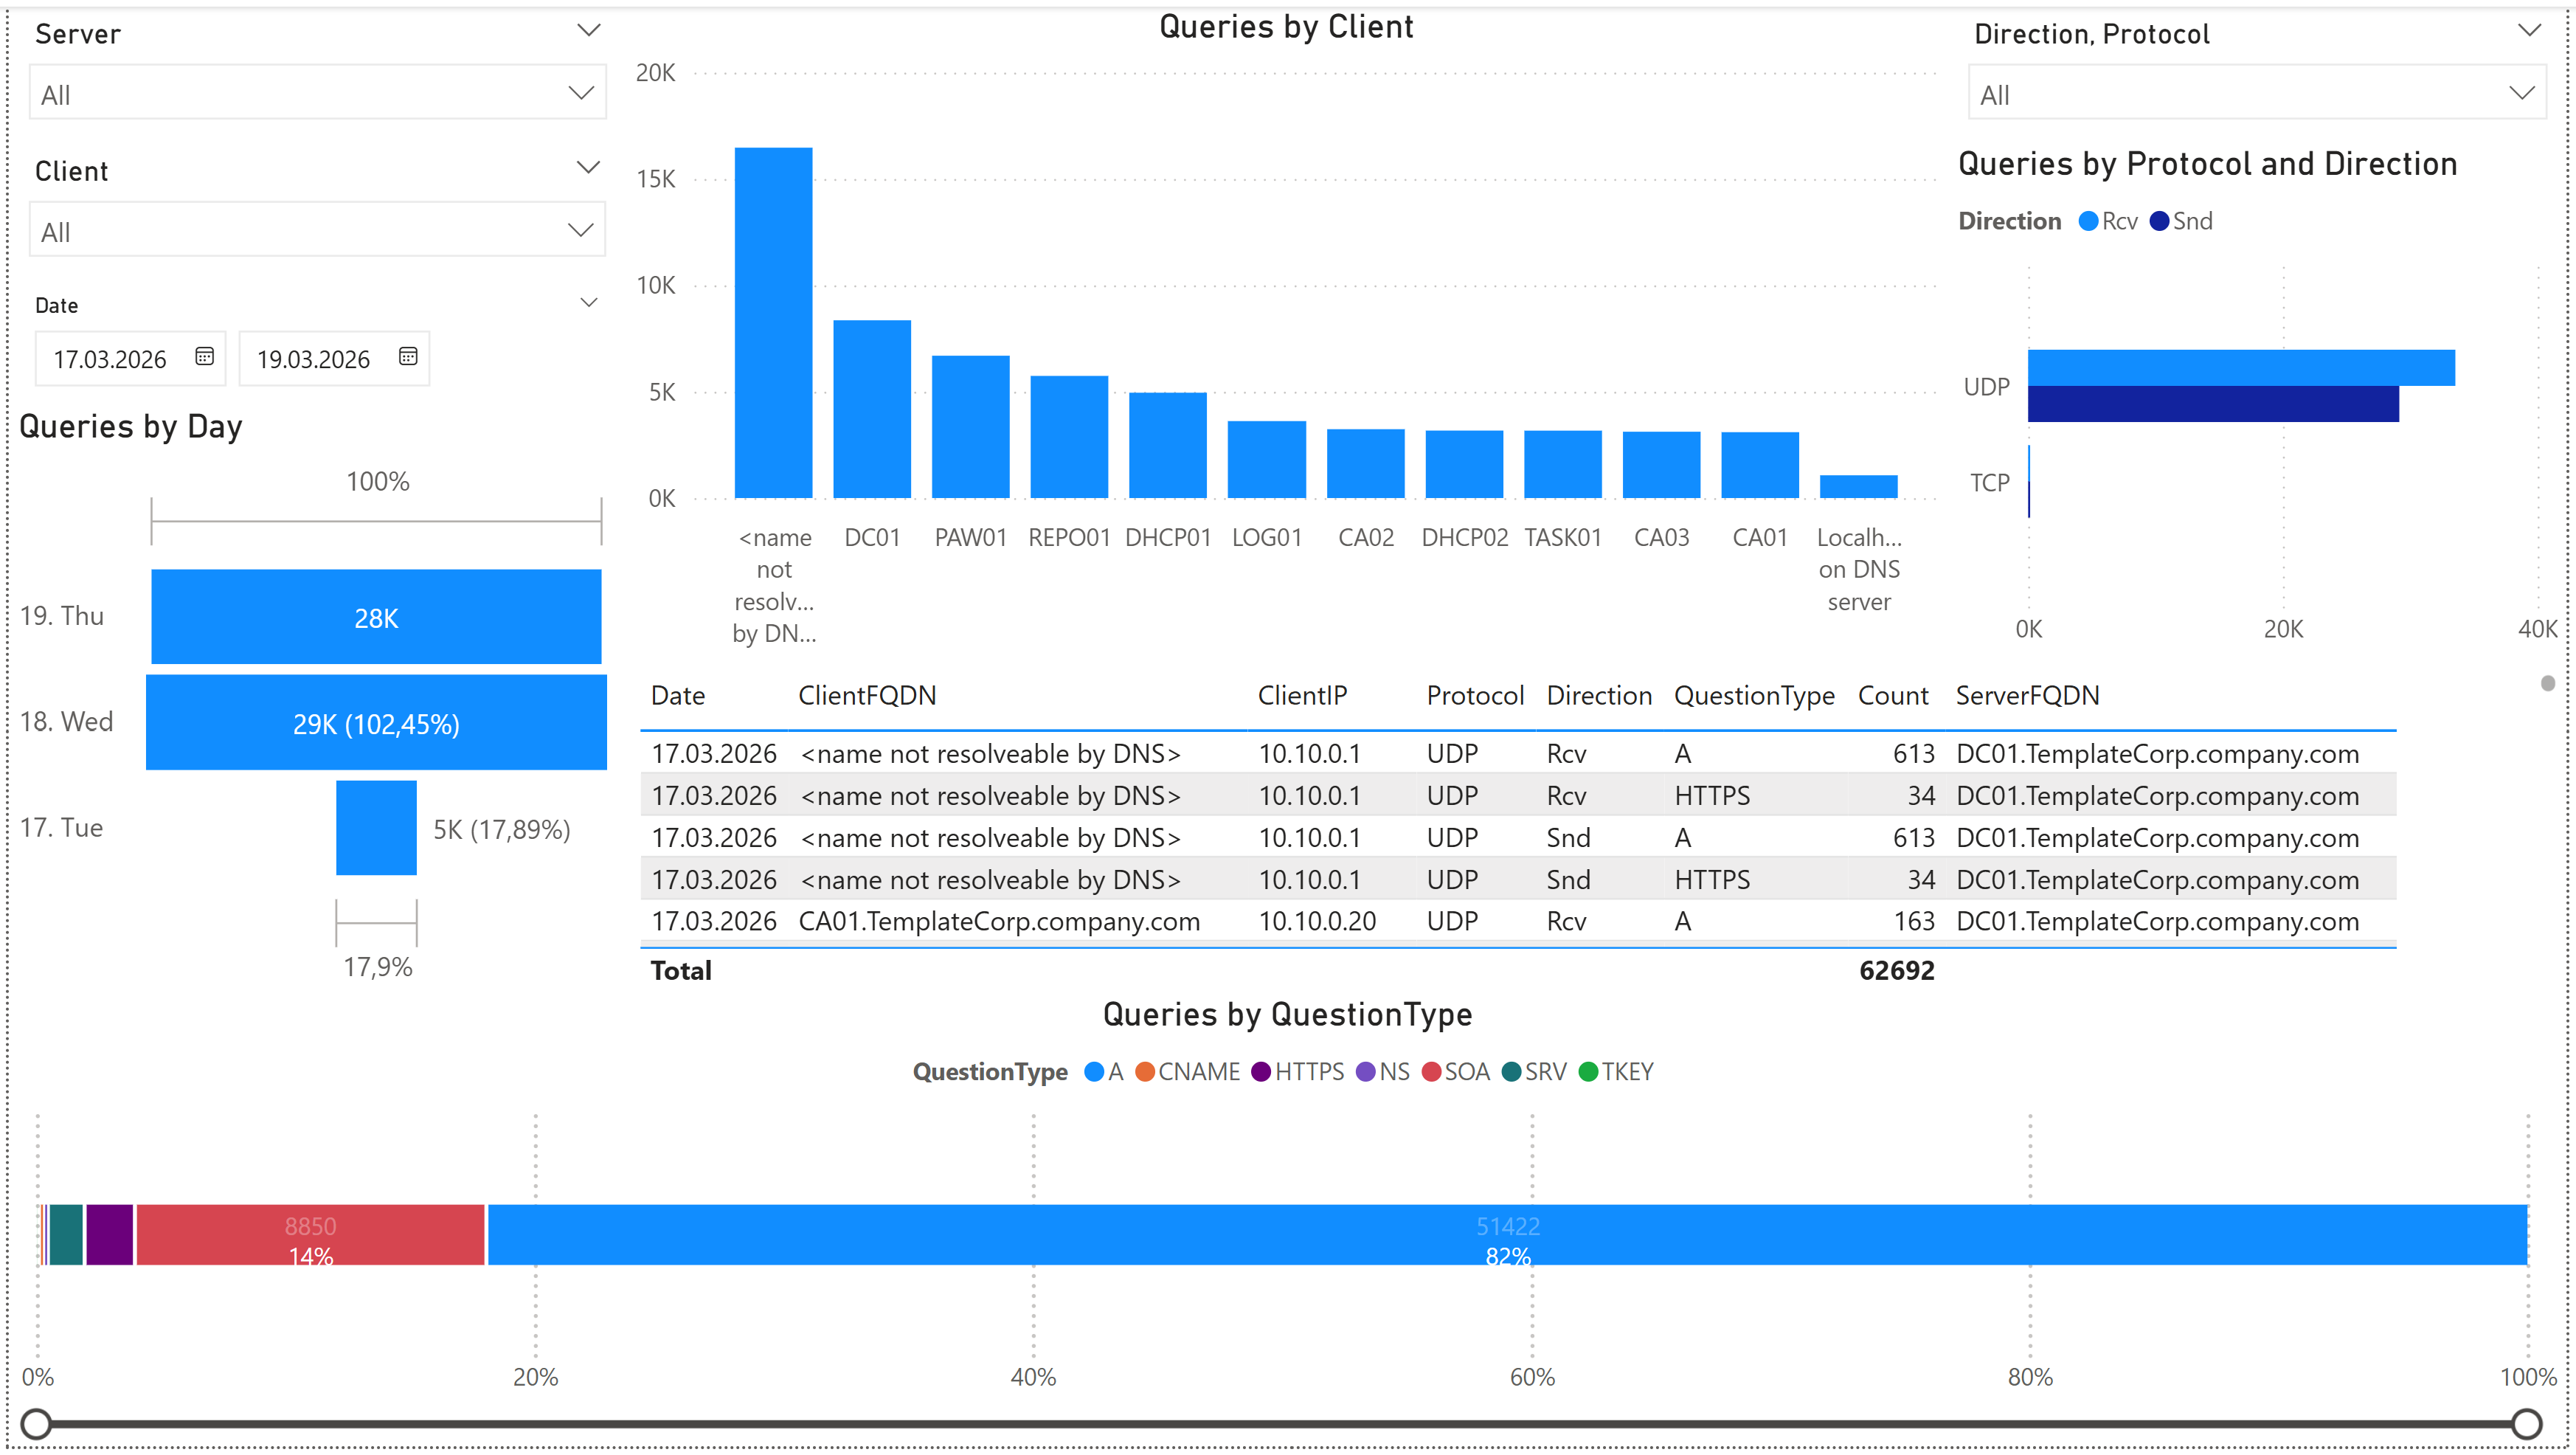
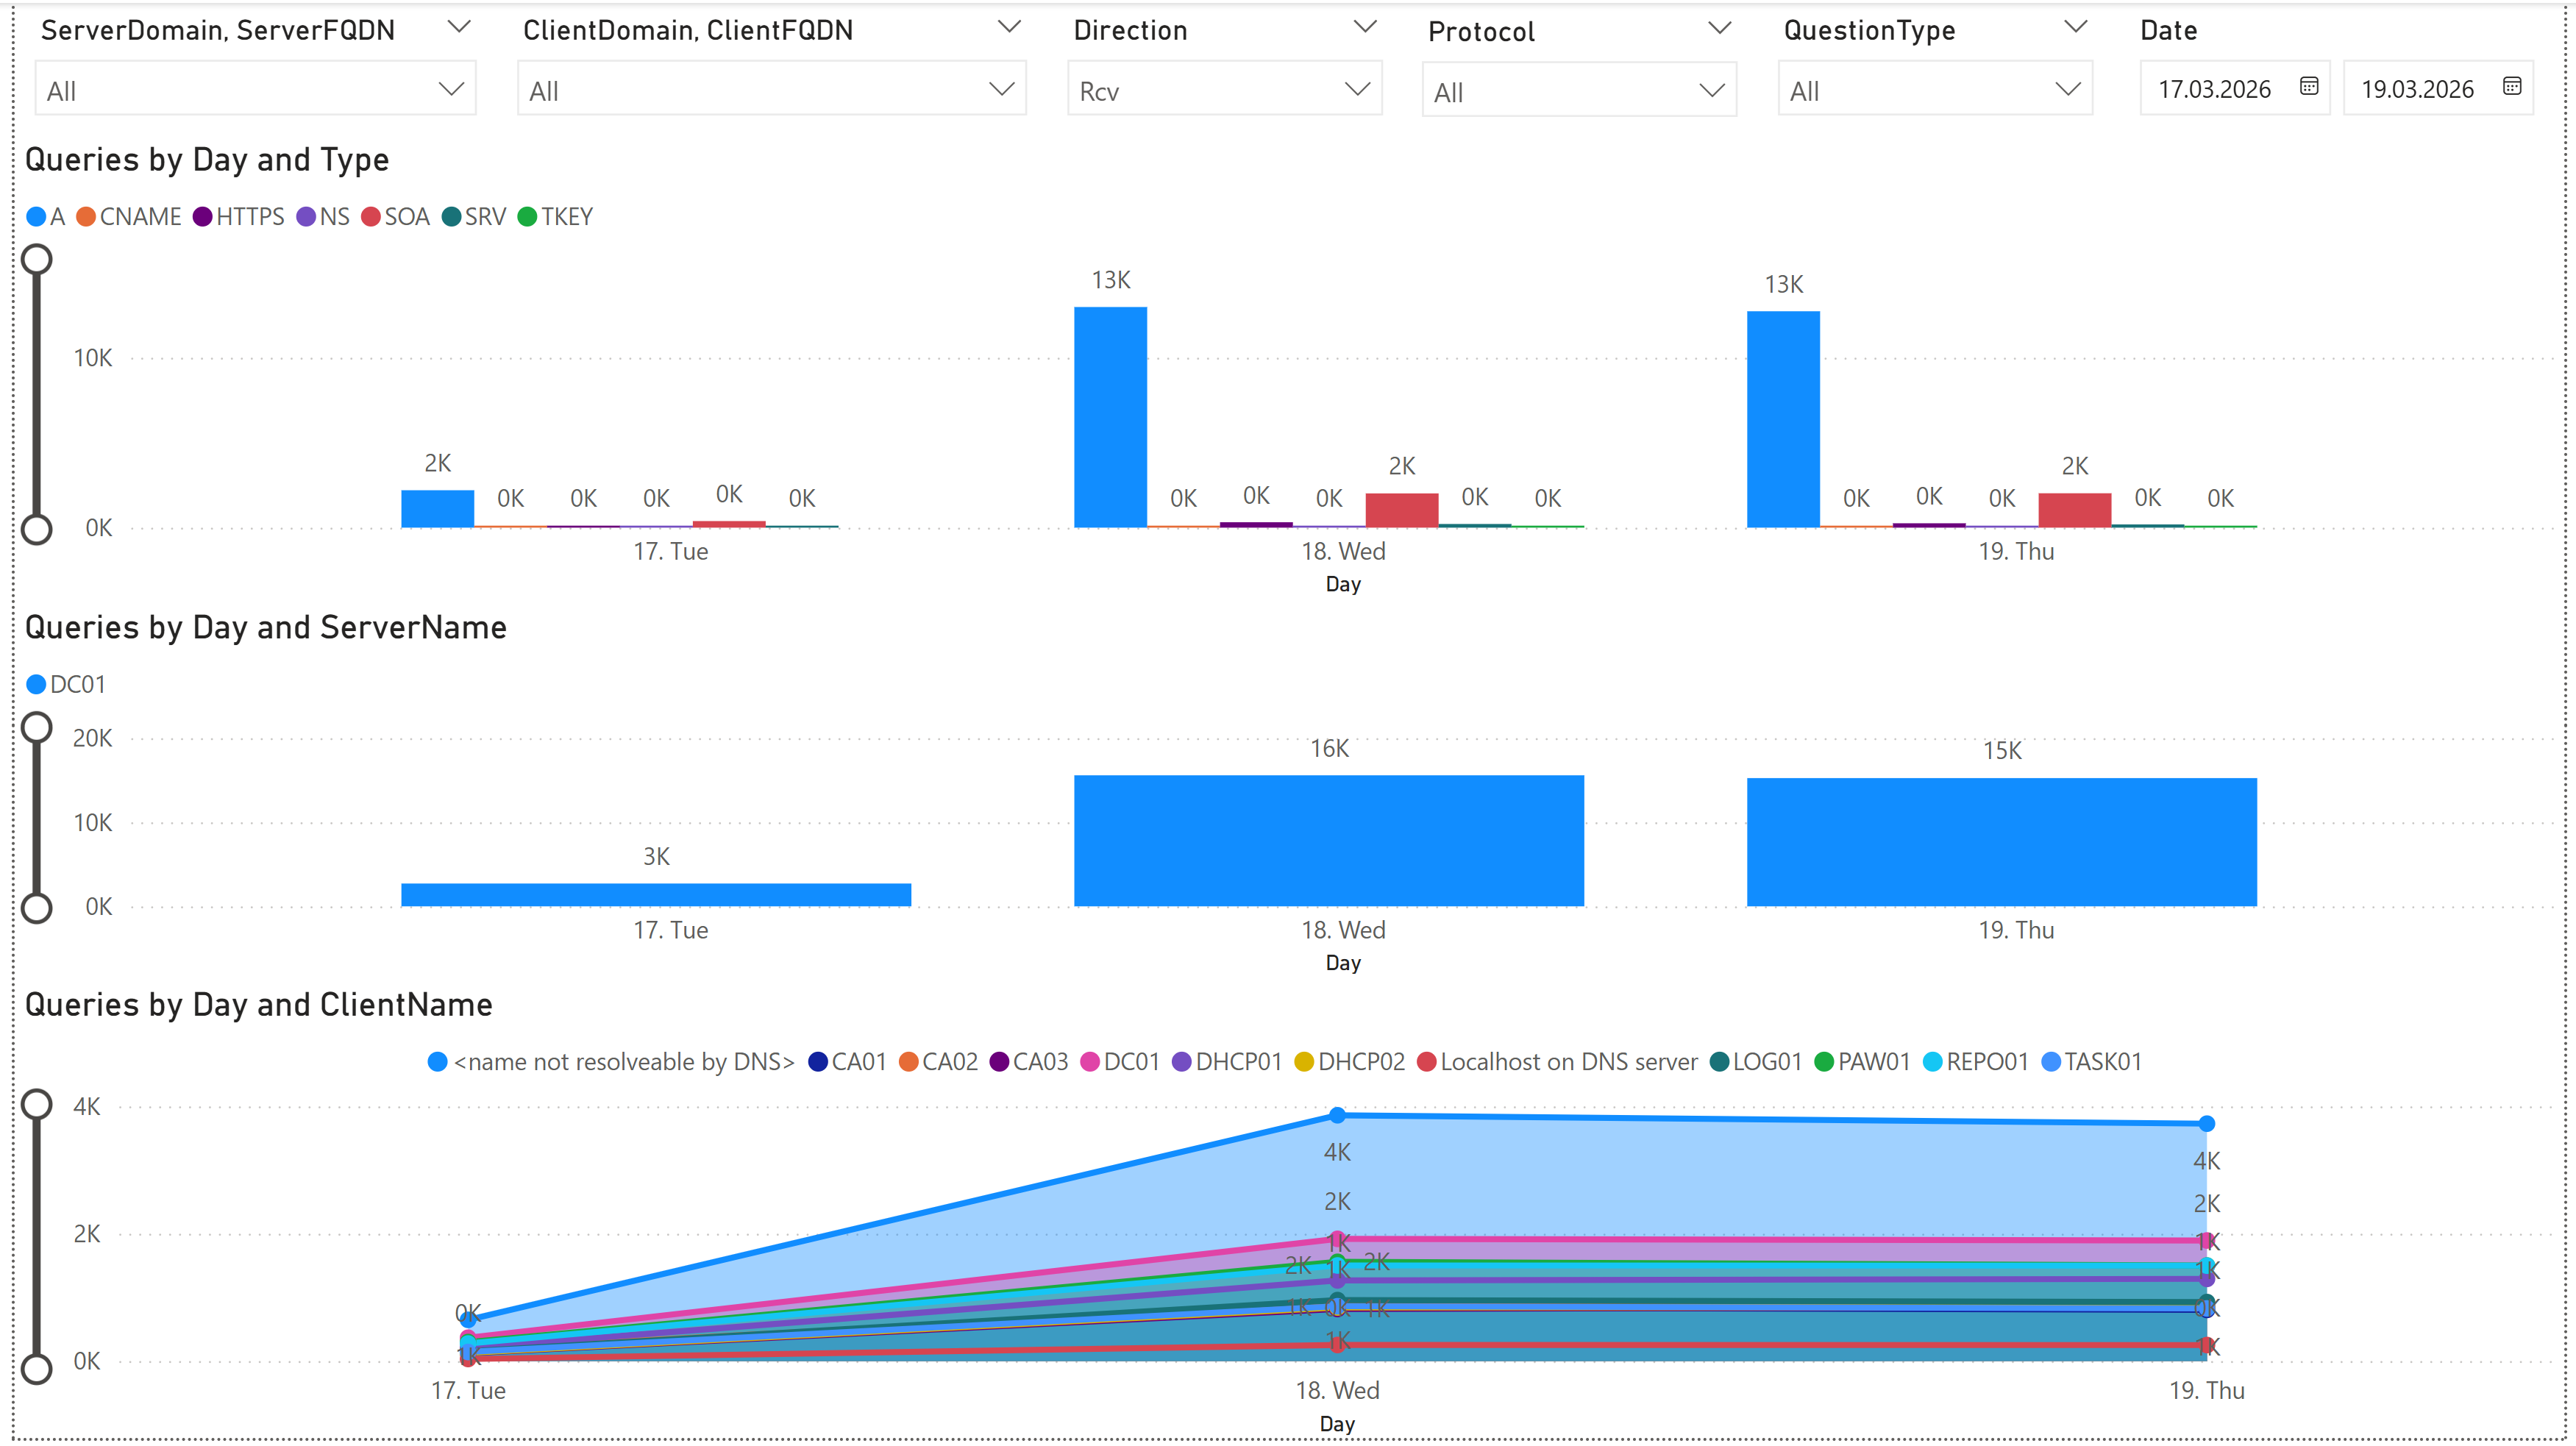
Same thing as mentioned in the previous section for the Excel examples… Everything is just an example and may not fit your needs. I did not put much effort into the design of the PowerBI reports, because I just want to give some examples for basic understanding. Depending on the size of your environment and the amount of data, your reporting may look totally different.
The main point is, with PowerBI you have the power to create your own reports and dashboards, that can be automatically refreshed on a regular basis and are easily accessible by multiple users without knowing how to deal with the underlying data.
In case you still want to have a look on the PowerBI file with the examples, here is the PowerBI file with the data and the examples.
Conclusion
With all that given, you are now well equipped to dig into the world of DNS Server debug logging.
You have the knowledge to enable and configure the debug logging, as well as to consume and analyze the generated data. Whether you choose to do quick analysis in PowerShell, or to create detailed reports in Excel or PowerBI, the choice is yours. Just remember, with great power comes great responsibility, so be mindful of the amount of data you are collecting and how you are using it.
🚀 Happy logging and analyzing! 🚀
Related Links
- Microsoft Docs: Debug Logging in DNS Server - Official documentation on enabling and using debug logging in DNS Server.
- PowerShell Gallery: DNSServer.DebugLogParser - PowerShell module for parsing DNS Server debug log files.
- GitHub Repository: DNSServer.DebugLogParser - GitHub repository for the DNSServer.DebugLogParser module, including documentation and example scripts.
- PowerQuery Documentation - Official documentation for PowerQuery, a powerful data transformation and analysis tool that can be used with Excel and PowerBI.
- PowerBI Documentation - Official documentation for PowerBI, a powerful business analytics tool that can be used to create interactive reports and dashboards.
Other links
Memes from makeameme.org